Print Back to top

Treated Water Quality Summary

Need more details about your water?

Your water’s journey starts as mountain snowpack and ends with the clean, great-tasting water that comes out of your tap. Last year, we collected more than 55,000 samples and conducted nearly 200,000 tests to ensure our water is as clean and safe as possible.

Some customers, such as beer brewers, pet stores or coffee shops, have more detailed questions about water hardness, metals and compounds than what’s included in Denver Water’s annual water quality reports. Those compounds, including emerging concerns, are listed below.

Watershed and reservoirs

Denver’s drinking water comes from rivers, lakes, streams, reservoirs and springs fed by high-quality mountain snow runoff. Denver Water’s supply is 100% surface water that originates in sources throughout 3,100 square miles of watersheds on both sides of the Continental Divide.

Treatment

Denver Water’s three treatment plants remove particulate matter and microscopic organisms that are found in surface waters. After filtration, chloramines are added as a disinfectant to inactivate potentially harmful microorganisms. Chloramines provide a longer lasting disinfection method than free chlorine, keeping water clean throughout Denver’s extensive distribution system. They also produce lower concentrations of disinfection byproducts than free chlorine.

Denver Water’s water quality laboratory analyzes and tests samples before and after the treatment process for compliant and noncompliant compounds. Some compounds may not be regulated by state or federal agencies, but Denver Water monitors them. All drinking water, including bottled water, may reasonably be expected to contain at least small amounts of some contaminants. The presence of contaminants does not necessarily indicate that the water poses a health risk.

Water quality monitoring

Denver Water serves 25% of the state’s population with less than 2% of all water used in the state. The natural environment is our lifeline, and we help protect it by promoting wise water use. We take our water quality very seriously. Last year we collected more than 55,000 samples and conducted more than 200,000 tests to ensure our water is as clean and safe as possible. Denver Water vigilantly safeguards our mountain water supplies, and the water is carefully treated before it reaches your tap. As you’ll see below, Denver Water rarely, if ever, exceeds safe levels of contaminants.

Your water is safe to drink, bathe and clean.

Compounds we monitor that are not listed in our annual water quality report include:

Compound or Organism Name

Category

Summary

Regulated?

Average

Range

Maximum Contaminant Level

Source

Total coliforms and
E. coli

Microbiological

Opportunistic bacteria that can be harmful if ingested. Escherichia coli (E. coli) is a specific species of coliform essential to the human digestive tract and causes serious illness when encountered outside of that context. Sampled throughout finished water distribution system to verify system containment.

Yes

0.03%
(Excludes invalid test results)

0% – 0.3%

5% of samples per month

Distribution System

Heterotrophic Plate Count (HPC)

Microbiological

Measures the variety of bacteria commonly found in water. This is often helpful information that is used to gauge how well-maintained the water system is.

No

ND (nondetect)

ND – 21 CFU (colony forming units)

N/A

pH

Inorganic

Characteristic that describes the acidity or neutrality of a water-based solution.

No

8.8 SU (standard units)

8.5 – 9.1

N/A

Treatment Plant

Hardness

Inorganic

Amount of minerals dissolved in water, namely calcium and magnesium.

No

88.8 ppm (parts per million)

51.0 – 131.0 ppm

N/A

Alkalinity

Inorganic

Property of water that describes its ability to neutralize added acids and bases while maintaining its pH.

No

55.9 ppm

34.0 – 80.0

N/A

Specific Conductance

Inorganic

Specific conductance is the ability of a substance to conduct electricity. It is the reciprocal of specific resistance. Conductance means the flow of current through the liquid conductor.

No

293.9 µS/cm

142-385 µS/cm

N/A

Treatment Plant

Inorganic Anions

Bromide

Inorganic

Found within Earth’s crust and sea water. Interaction with disinfectant chemicals may produce disinfectant byproducts.

No

ND

ND – 0.7 ppm

N/A

Treatment Plant

Chloride

Found in nearly all waters and is derived from a number of sources, including natural mineral deposits; seawater intrusion or airborne sea spray; agricultural or irrigation discharges; urban run-off due to the use of de-icing salts; or from sewage and industrial effluents.

No

17.8 ppm

5.8 – 97.0 ppm

N/A

Fluoride

Naturally occurring in water from interaction with soils and bedrock. Can be added to public drinking water to reduce dental cavities.

Yes

0.6 ppm

0.5 – 2.3 ppm

4 ppm

Nitrate

Runoff from fertilizer use; leaching from septic tanks, sewage; erosion of natural deposits.

Yes

0.1 ppm

ND – 1.7 ppm

10 ppm

Nitrite

Yes

ND

ND

1 ppm

Orthophosphate

Sources include agricultural and residential fertilizers. A nutrient essential to the growth of plants, but too much present in water leads to overgrowth of oxygen-consuming bacteria that concentrate minerals and organic matter in the water source. For this reason, it is monitored in environmental water sources as an indication of water quality.

No

ND

ND

N/A

Sulfate

Can become present in surface water through contact with naturally occurring sulfate minerals.

No

43.3 ppm

21.0 – 66.0 ppm

N/A

Metals

Aluminum

Inorganic

Abundant in Earth’s crust. Aluminum salts used in municipal water treatment to purify water.

No

28.7 ppb (parts per billion)

16.6 – 39.9 ppb

50 ppb

Treatment Plant

Antimony

Naturally occurring in ore deposits and widely used in the production of flame retardants. It is a known human carcinogen.

Yes

ND

ND

6 ppb

Arsenic

Natural component of the Earth’s crust; if found in water, the source is usually groundwater. Known to be toxic to humans and manifests as skin lesions and cancer.

Yes

ND

ND

10 ppb

Barium

Erosion from natural deposits.

Yes

33.6 ppb

18.9 – 40.0 ppb

2,000 ppb

Beryllium

Naturally occurring in ore deposits and is used in metal alloy production. Long-term exposure has the potential to damage human bones and lungs.

Yes

ND

ND

4 ppb

Cadmium

Used primarily for metal coating/plating for a variety of industries. Long-term exposure may result in liver, kidney, bone and blood damage.

Yes

ND

ND

5 ppb

Calcium

Essential nutrient for human bone and teeth development. Contributor to water’s hardness. Presence in water from interaction with exposed rocks.

No

25.6 ppm

16.6 – 30.7 ppm

N/A

Chromium

Trivalent configuration is naturally occurring in Earth’s crust and is an essential nutrient for humans. Hexavalent configuration is produced by metal production operations and is a known carcinogen.

Yes

ND

ND

100 ppb

Copper

Naturally occurring metal found in rocks, soil and sediment. Elevated level likely the result of plumbing and fixtures interacting with corrosive water.

Yes

31.3 ppb

ND – 460.7 ppb

1,300 ppb

*Lead

Chronic exposure detrimental to child neurological development. Lead detected in drinking water likely the result of plumbing and fixtures interacting with corrosive water.

Yes

ND

ND – 8.6 ppb

15 ppb

Magnesium

Contributor to water’s hardness. Presence in water from interaction with exposed rocks. Principal cause of scale formation in boilers, water heaters and pipes.

No

6.0 ppm

2.0 – 8.7 ppm

N/A

Mercury

Extremely poisonous substance with multiple routes of absorption. Released into the environment through natural weathering processes.

Yes

ND

ND

2 ppb

Molybdenum

Considered an essential trace element for humans and animals. Found widely throughout nature, normally in trace amounts, though mining operations contribute to large discharges.

No

7.7 ppb

ND – 14.7

N/A

Selenium

Common element in Earth’s crust and an essential dietary element. At high concentrations, some selenium compounds may cause damage to the nervous system.

Yes

ND

ND

50 ppb

Sodium

Widely distributed in environment. Added in during water treatment process in chemicals that assist with pH adjustment.

No

19.6 ppm

10.4 – 27.6 ppm

N/A

Thallium

Used most often in electronic research equipment. Exposure to high levels can cause nerve damage, and long-term exposure may result in changes to blood chemistry.

Yes

ND

ND

2 ppb

Uranium

Naturally occurring radionuclide in granite and other mineral deposits. Long-term exposure increases the risk of cancer and kidney damage.

Yes

ND

ND

30 ppb

Total Organic Carbon (TOC)

Organic

Naturally occurring, carbon-containing compounds in water indicative of the presence of living organisms (twigs, bacteria, etc.)

Yes

2.2 ppm

1.3 – 2.7 ppm

Treatment technique

Treatment Plant

Dissolved Organic Carbon (DOC)

Organic

The fraction of water’s total organic carbon content that can pass through a 0.22 micron filter.

Yes

1.8 ppm

1.3 – 2.5 ppm

Treatment technique

Treatment Plant

Disinfectant Byproducts (DBPs)

HAA5

Organic

Formation of trihalomethanes (TTHMs) and/or haloacetic acids (HAA5) occurs when chlorine-based disinfectants used during the treatment process react with organic matter in water. 

Yes

16.1 ppb

11.6 – 21.6 ppb

60 ppb

Treatment Plant

TTHM

Yes

20.9 ppb

15.3 – 29.3 ppb

80 ppb

Taste & Odor (T&O) Compounds

Geosmin

Organic

Molecules released from algae occurring in freshwater sources that are not lethal/toxic when ingested but are not aesthetically pleasing when present in water. The lab monitors two of the most prevalent compounds; geosmin and 2-methylisoborneol (MIB).

No

1.5 ppt

ND – 15 ppt (parts per trillion)

N/A

Treatment Plant

2-methylisoborneol
(MIB)

No

ND

ND

N/A

Volatile Organic Compounds (VOC)

1,1,2-Trichloroethane

Organic

Compounds that contain carbon and are a gas at room temperature but can be found in several different forms throughout the environment. Most VOCs of interest are used as solvents in the production of other chemicals or are useful in the production of plastic-type products. The analytes listed here were selected because they are either known or suspected carcinogens.

Yes

ND

ND

5 ppb

Treatment Plant

1,2-Dichloroethane

Yes

ND

ND

5 ppb

1,2-Dichloropropane

Yes

ND

ND

5 ppb

1,2,3-Trichloropropane

No

ND

ND

5 ppb

1,4-Dioxane

No

ND

ND

5 ppb

Benzene

Yes

ND

ND

5 ppb

Carbon tetrachloride

Yes

ND

ND

5 ppb

Dichloromethane

Yes

ND

ND

5 ppb

Styrene

Yes

ND

ND

100 ppb

Tetrachloroethylene

Yes

ND

ND

5 ppb

Trichloroethylene

Yes

ND

ND

5 ppb

Vinyl Chloride

Yes

ND

ND

5 ppb

Ammonia (NH3)

Inorganic

Often added during the disinfection of drinking water with chlorine to create chloramines; this reduces the formation of DBPs during disinfection and prolongs the period in which treated water can be deemed disinfected post-treatment.

No

303.8 ppb

260.0 – 352.0 ppb

N/A

Treatment Plant

*Lead - A sampling or laboratory error occurred with one sample from Foothills in October 2021. The lead result is not representative of Foothills treated water quality.

All data in table reflect samples taken from the distribution system, treatment plant effluents, or both.

Emerging contaminants

Because Denver Water’s drinking water supply originates in high-elevation rivers and reservoirs, PFAS-related compounds have not been an area of concern in our source water. We do test quarterly and since we started testing for PFAS compounds in 2017, we have not detected any in our drinking water.

  • Perfluorocarbons (PFCs) — Poly-fluorinated-carbons (PFCs) and poly and per-fluoroalkyl substances (PFAS) are found in food packaging, cookware, outdoor gear, furniture, carpeting and aqueous film forming foams (AFFF) used in firefighting. Denver Water monitors the influent and effluents of the potable treatment plants and has shown no detectable levels of PFCs in the drinking water .
  • Cyanotoxins — Cyanobacteria, commonly known as blue-green algae, are a class of aquatic microorganisms that can produce cyanotoxins. Health effects include gastrointestinal discomfort, liver inflammation, and skin rashes or dermatitis. Climate change is causing these algae blooms to occur more often than they used to. Denver Water continuously monitors and samples its source water for the presence of cyanobacteria and nutrient concentrations that favor bloom occurrences. Denver Water can switch or augment its source water to optimize water quality. To date, Denver Water has not had any detectable levels of cyanobacteria in its source or distribution water.
  • Microplastics Plastic materials are found everywhere and are slow to degrade. Microplastics are characterized as plastic material smaller than 5 millimeters and larger than 10 nanometers, but most concerning are plastic particles smaller than 25µm (micrometers) because they can pass into human tissue, causing inflammation and digestive problems. Denver Water is working with other labs and water industry professionals to develop consistent, repeatable and widely available methods of detecting and quantifying plastics in drinking water.
  • Taste and odor During the height of runoff throughout summer and the rapid temperature changes of the fall, there may be instances in which water will have an unusual or unfamiliar taste and/or odor when dissolved organic compounds are released from the dynamic microscopic community of organisms (including diatoms, plankton, zooplankton, algae and cyanobacteria) that are present in source water. These compounds are not harmful for human consumption; however, Denver Water continuously monitors and adjusts its source water to minimize potential taste and odor events. Denver Water can add powder activated carbon (PAC) into the treatment process to remove these compounds to make drinking water more palatable.
  • Lead — The water that Denver Water provides to homes and businesses is lead-free, but lead can get into the water as it moves through lead-containing household fixtures, plumbing and water service lines — the pipe that brings water into the home from the main in the street — that are owned by the customer. Denver Water is underway with its Lead Reduction Program, a 15-year effort to locate and replace the estimated 64,000 to 84,000 lead service lines in our service area.
  • Pharmaceuticals – These compounds enter water systems through trace amounts passing through consumers as well as disposal of medications into sinks or toilets. Denver Water has monitored for these compounds in its source water, particularly areas that may be influenced by treated wastewater and agriculture. 

Help us keep your drinking water clean

Denver Water’s Cross-Connection Control and Backflow Prevention Program protects the public water supply from pollutants and contaminants that could, under certain circumstances, be drawn into the public water supply from private properties. All commercial, industrial, domestic, irrigation and fire line services are required to have an approved backflow prevention assembly installed.

A backflow prevention assembly installed on the service line allows water to only flow into the building, preventing water from flowing in the opposite direction into the drinking water system. The sole purpose of a backflow prevention assembly is to prevent your drinking water from becoming contaminated.

What causes a backflow event?

Backflow is the unwanted flow of water or other liquids, mixtures, gasses or substances into the drinking water supply.

There are two main ways backflow can occur:

  • Backsiphonage occurs when there is a negative pressure in the water distribution system, which draws the water from a private water system into the public water system. This can occur at any time, such as during a water main break or during a large firefighting effort.
  • Backpressure occurs when the pressure in a private water system exceeds the pressure in the public water distribution lines that can cause normal flow to reverse. A pump used to increase the water pressure within a building’s plumbing system to reach a higher floor might cause this.

Click image to see it larger.

Without Backflow Prevention Assembly

Click image to see it larger.

Without Backflow Prevention Assembly

Why is a survey/test/installation necessary now, but was not required before?

In 2016, the state passed State Regulation 11.39, mandating water utilities provide and maintain a cross-connection control and backflow prevention program. Water purveyors are required by the Colorado Department of Public Health and Environment to survey all water services to determine if potential hazards to the potable water supply are protected by a backflow prevention assembly.

Click image to see it larger.

In 2016, there was 66% completion rate, in 2017 88% completion rate, in 2018 a 93% completion rate, in 2019 a 95 percent completion rate, in 2020 a 96% completion rate (the goal was 91%), in 2021 a 96% completion rate (the goal was more than 95%).

What happens when Denver Water inspects my water service line?

A Denver Water employee will locate the water service line connection to the building. Then the employee will document the property type and any potential hazards, such as pesticides, chemicals, nonpotable water and others, to the water distribution system.

Backflow prevention assemblies contain the hazard from the potable water distribution system and are required to be tested annually. Denver Water processes more than 40,000 cross-connection control backflow test reports annually and reports the tests to the Colorado Department of Public Health and Environment to ensure the safety of your drinking water.

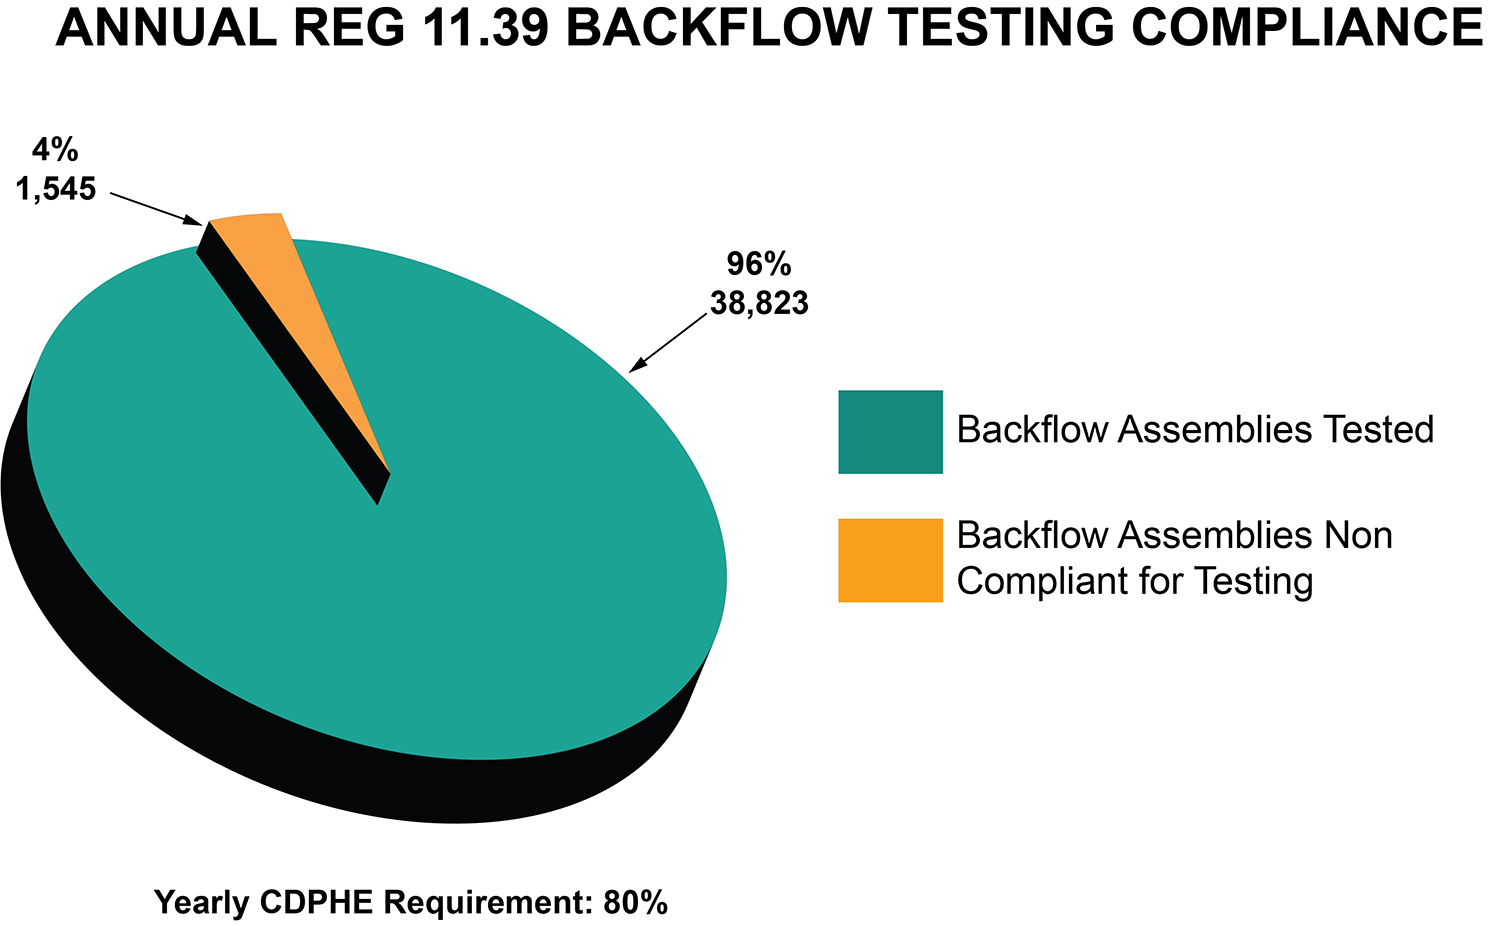
Backflow testing compliance

The chart below shows the number of backflow assemblies in Denver’s service area that complied with the state regulation annual testing requirements in 2021. Denver Water completes more than 60,000 surveys of backflow assemblies to comply with state regulations.

Image