

You may also download dashboard.
Previous months' dashboards
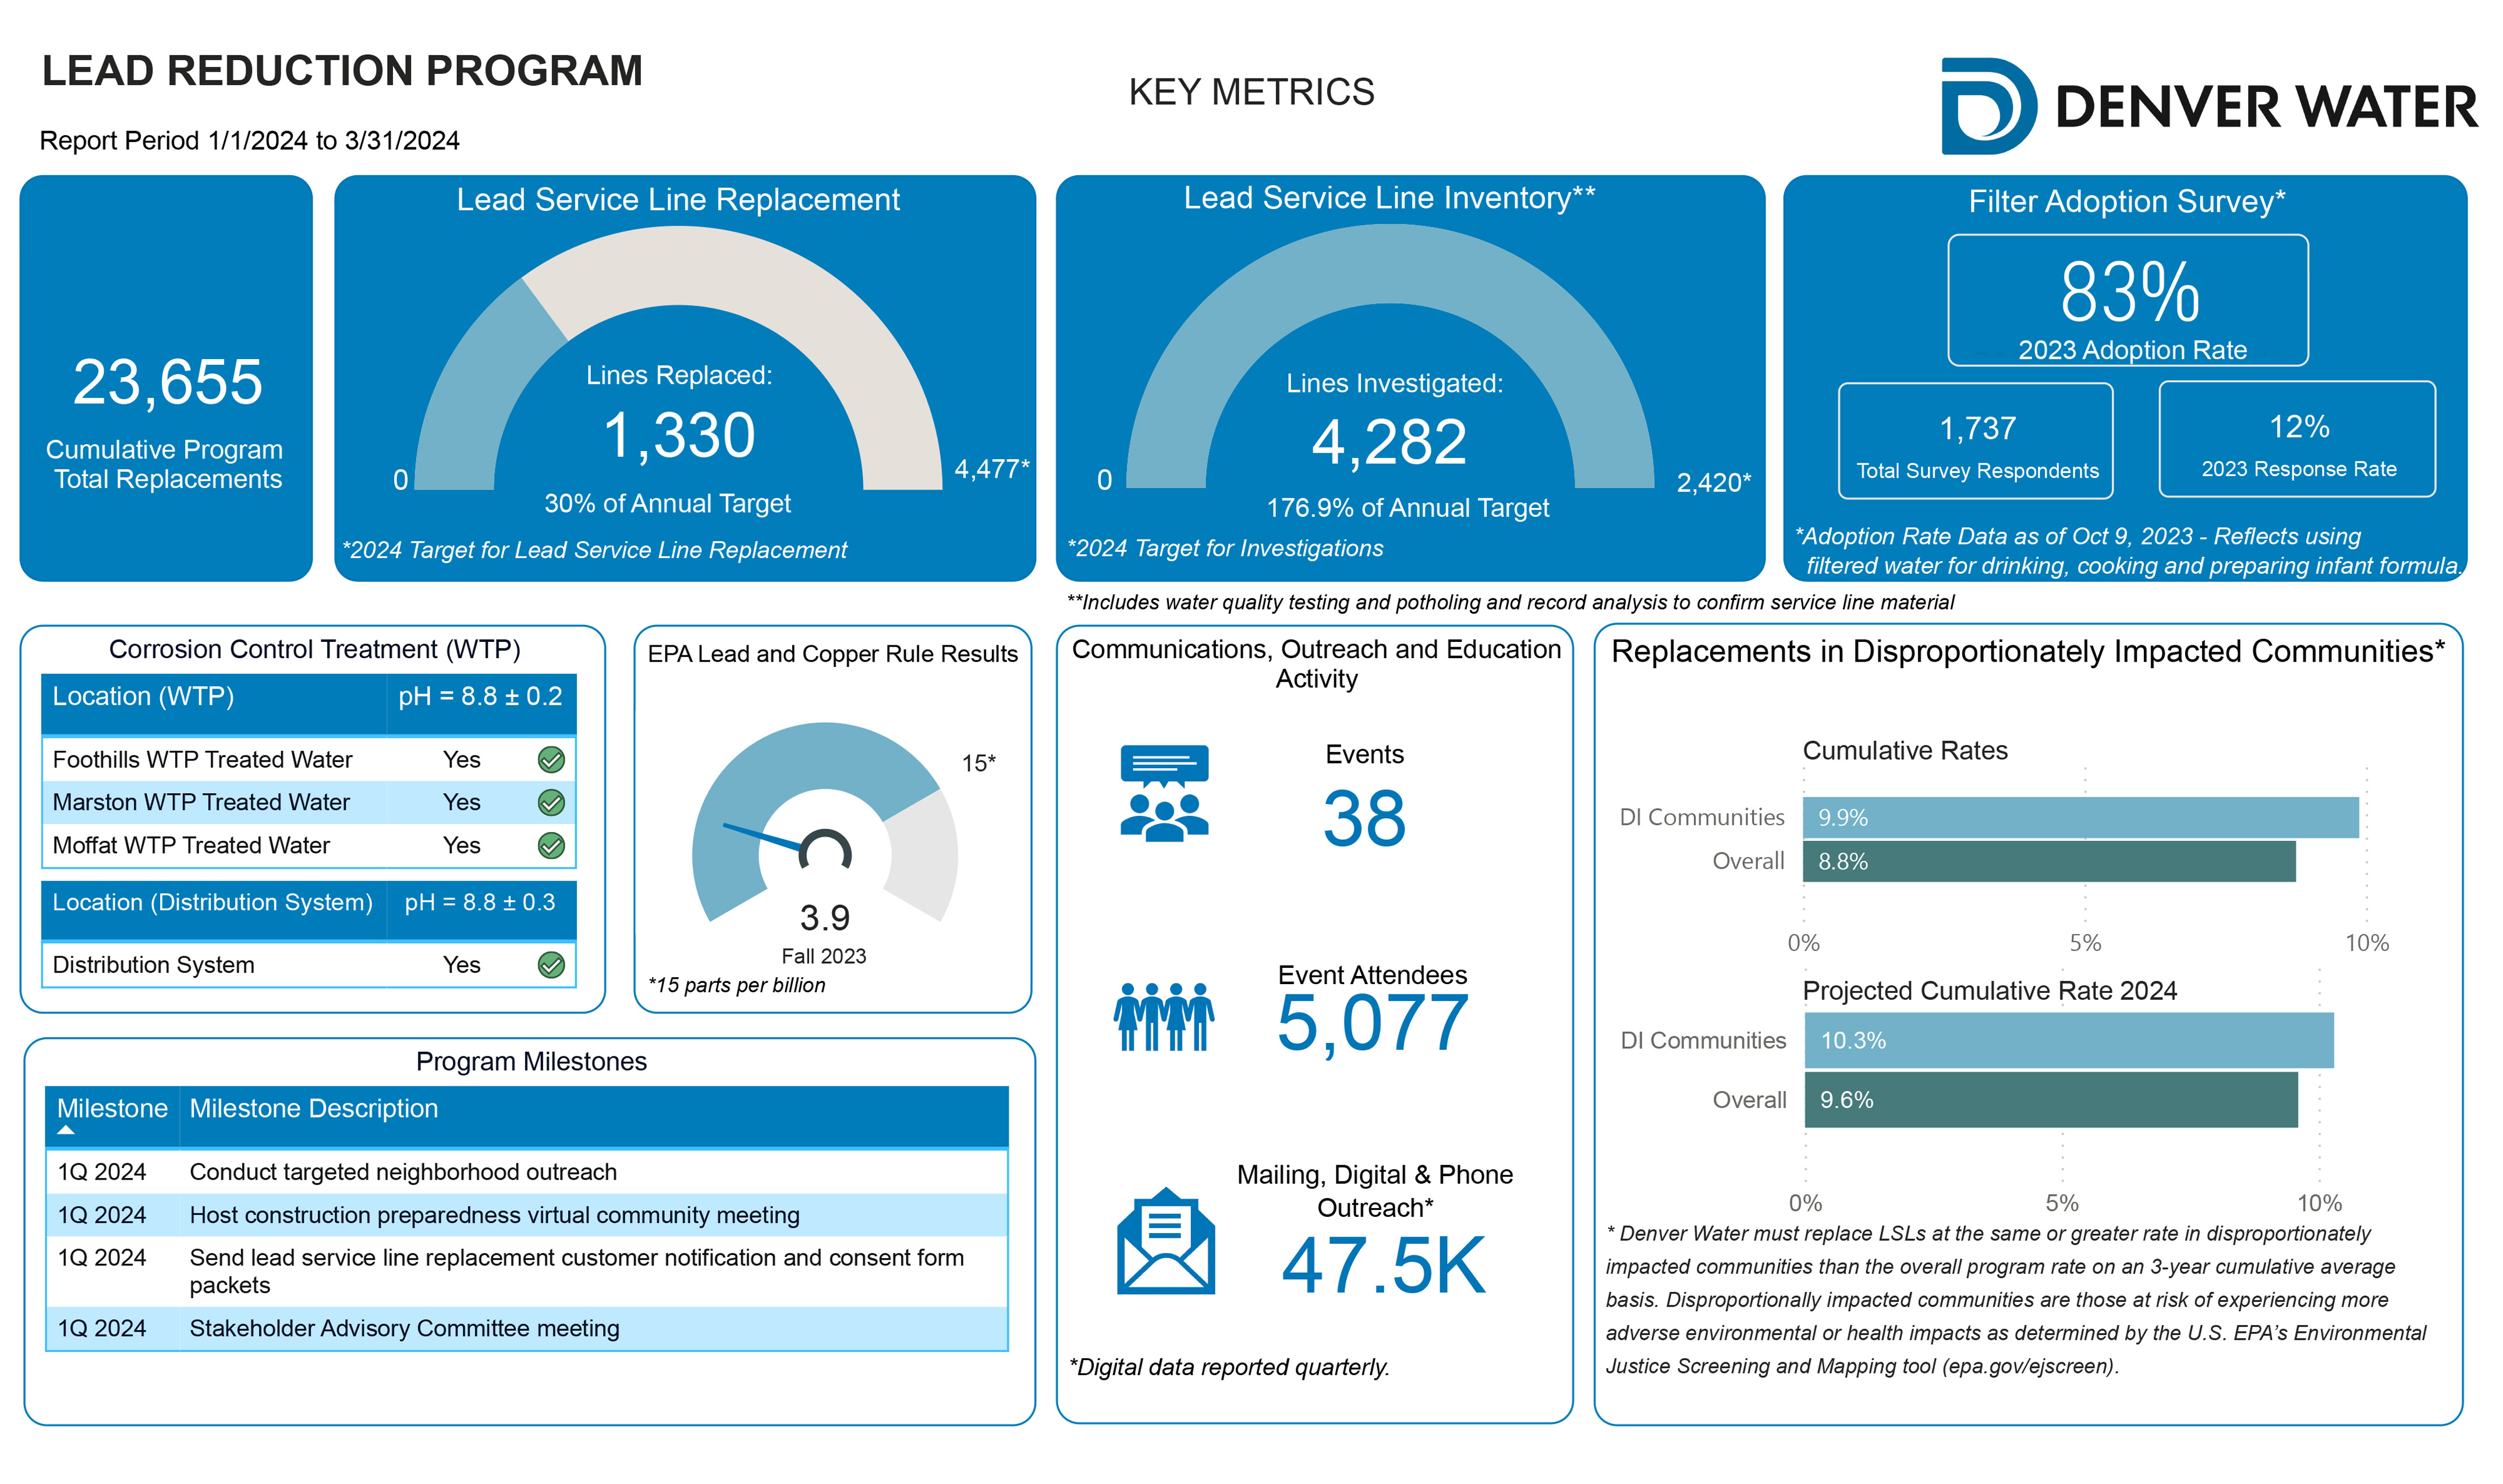
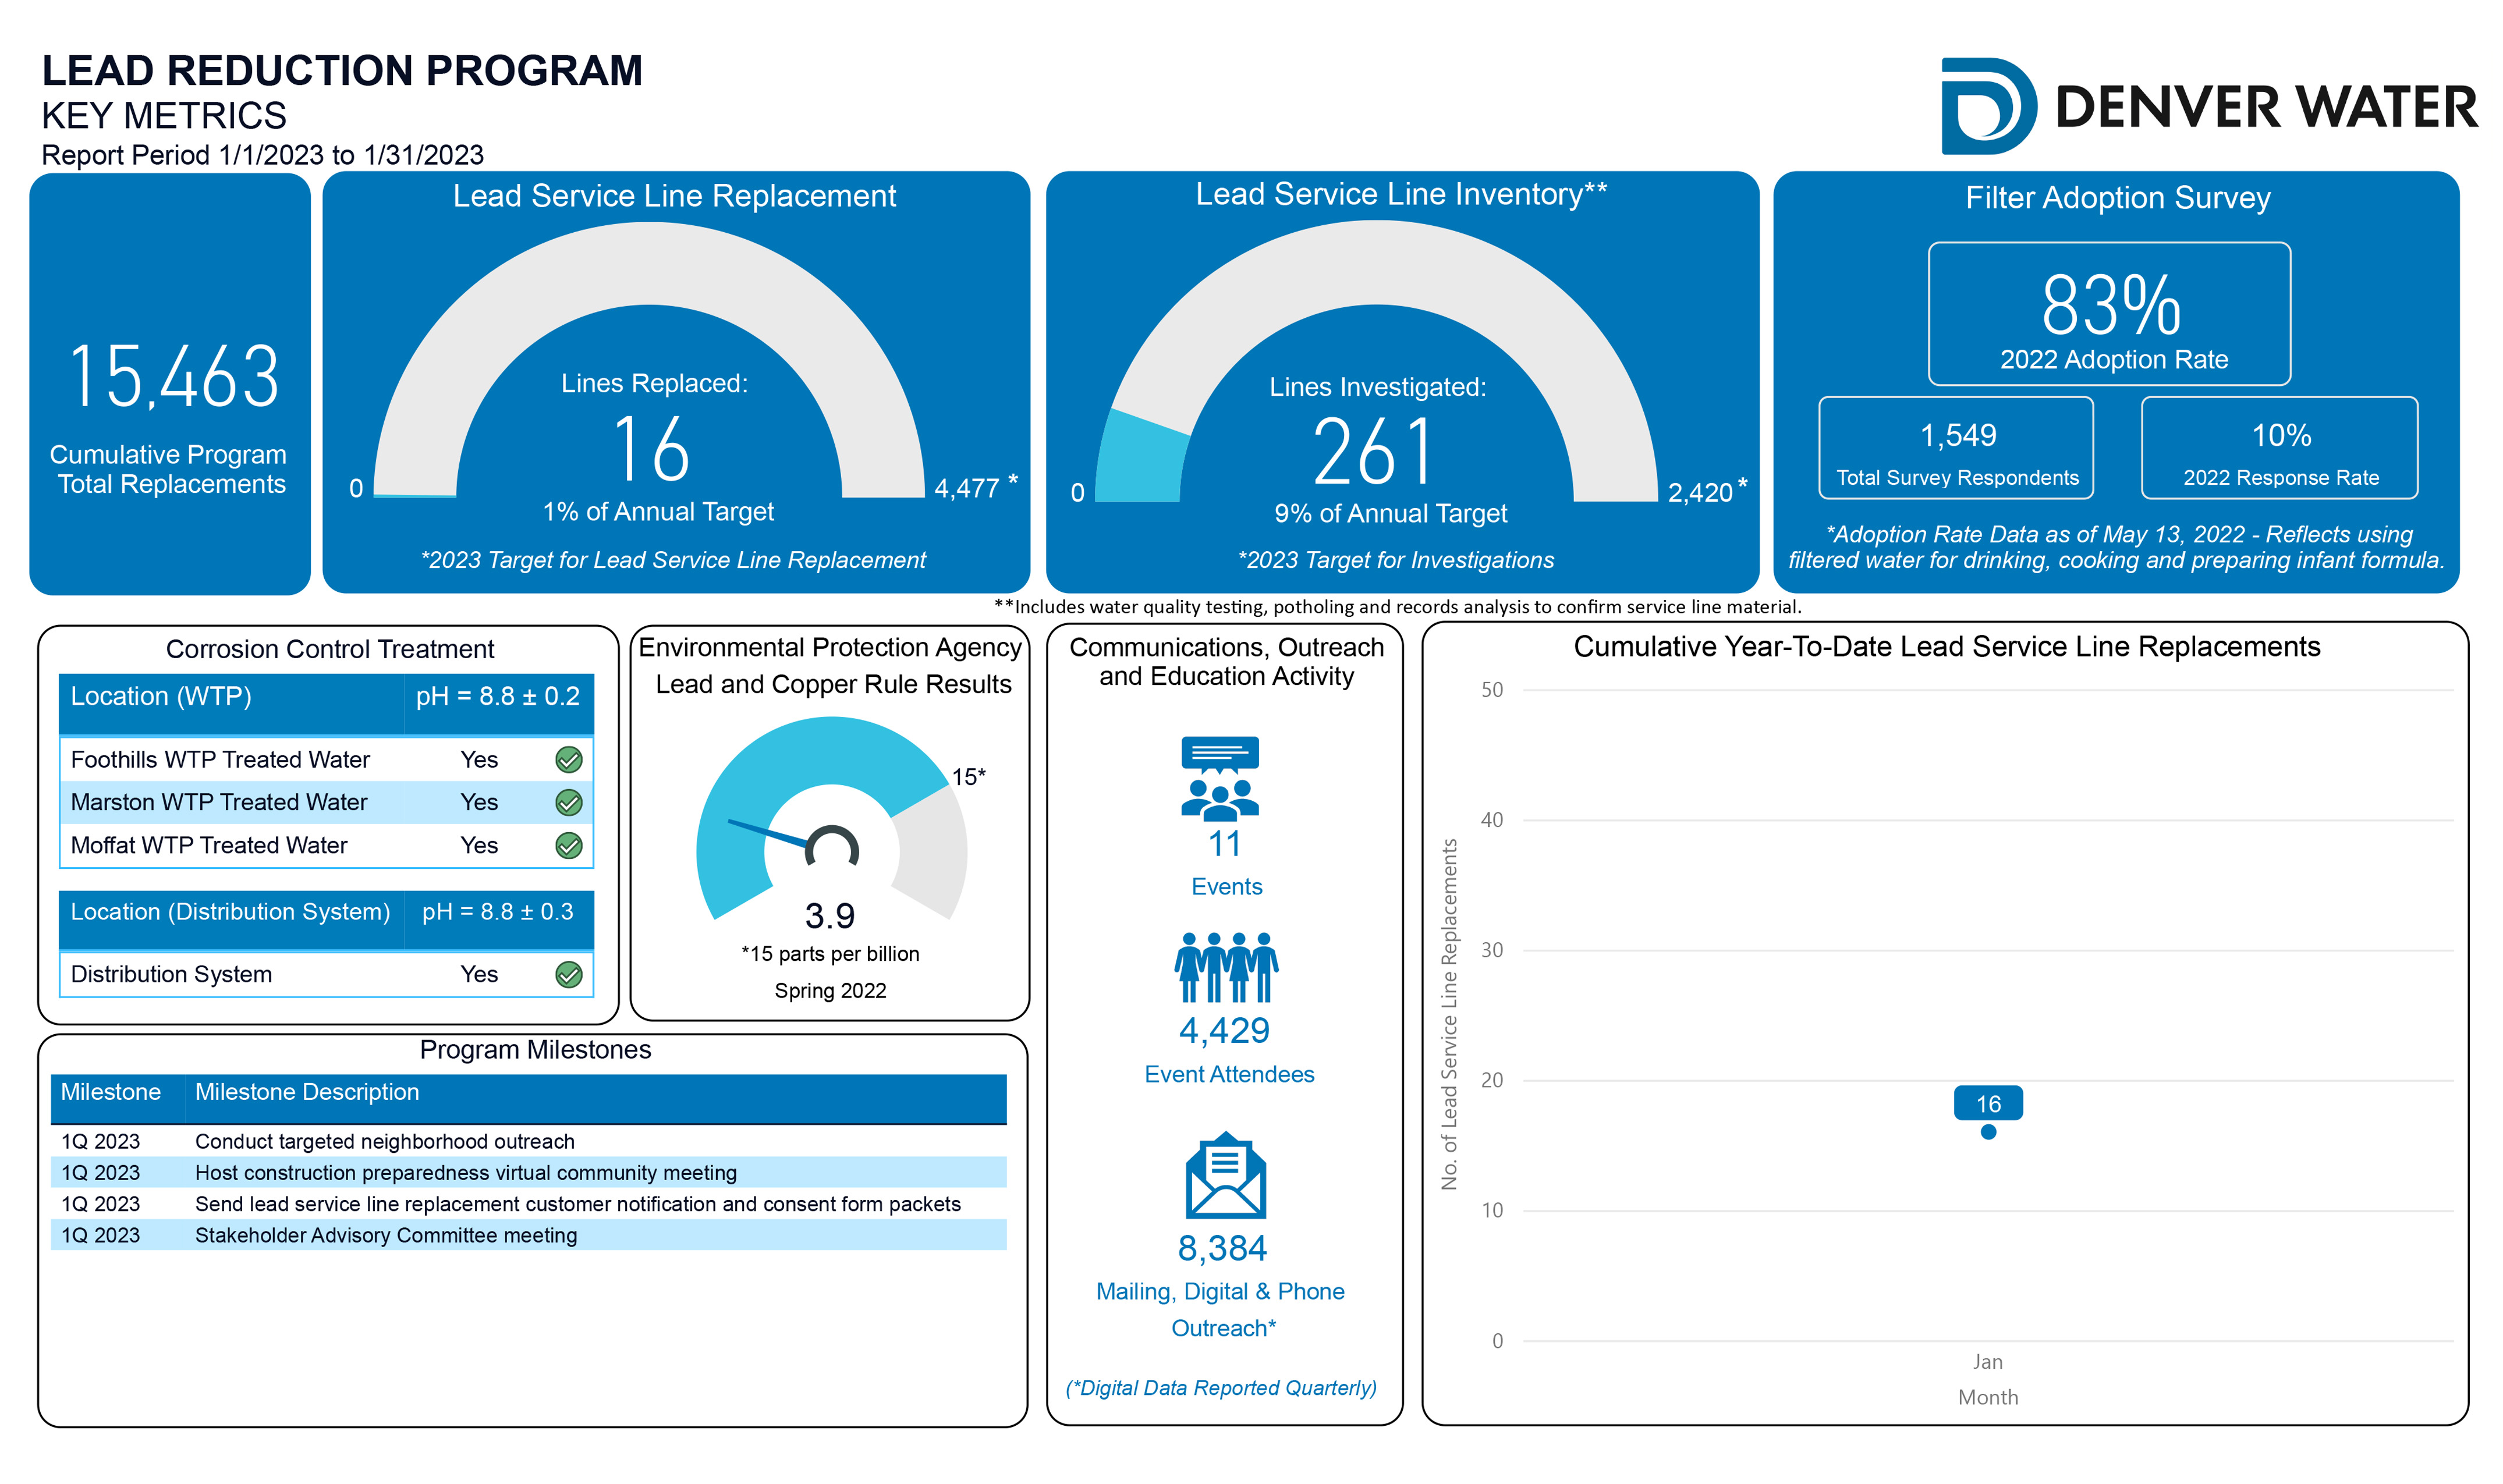
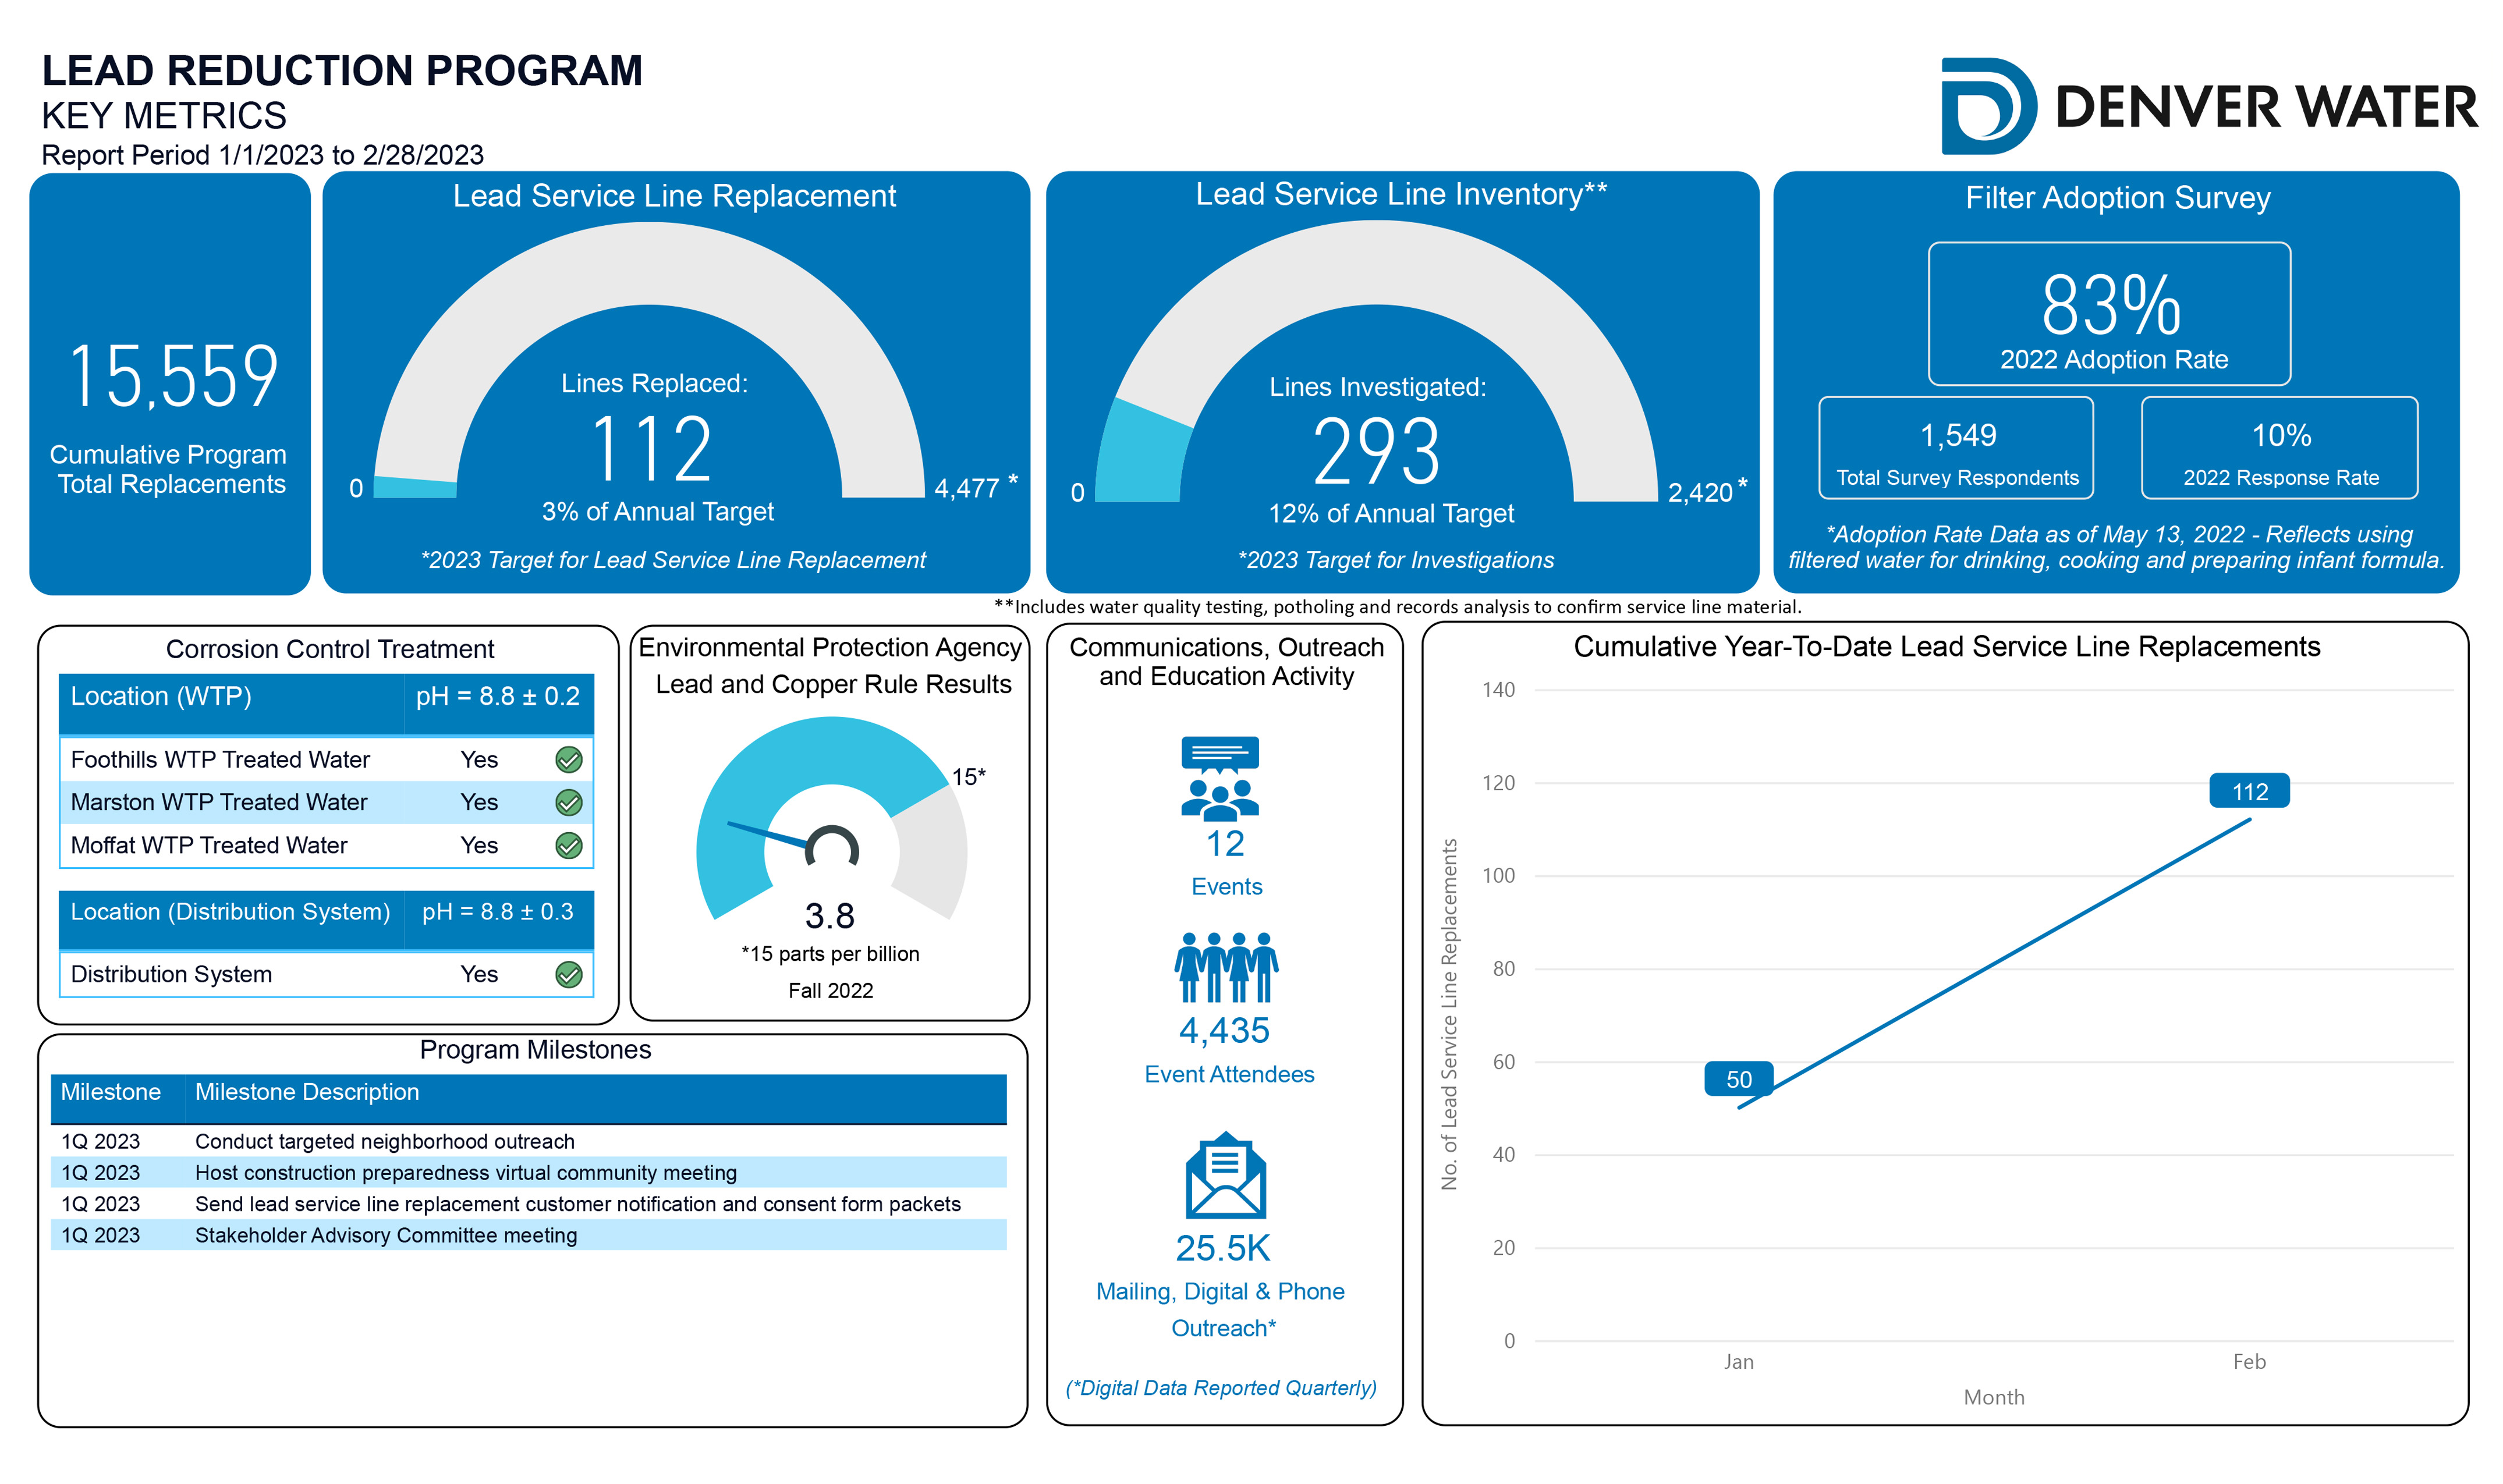
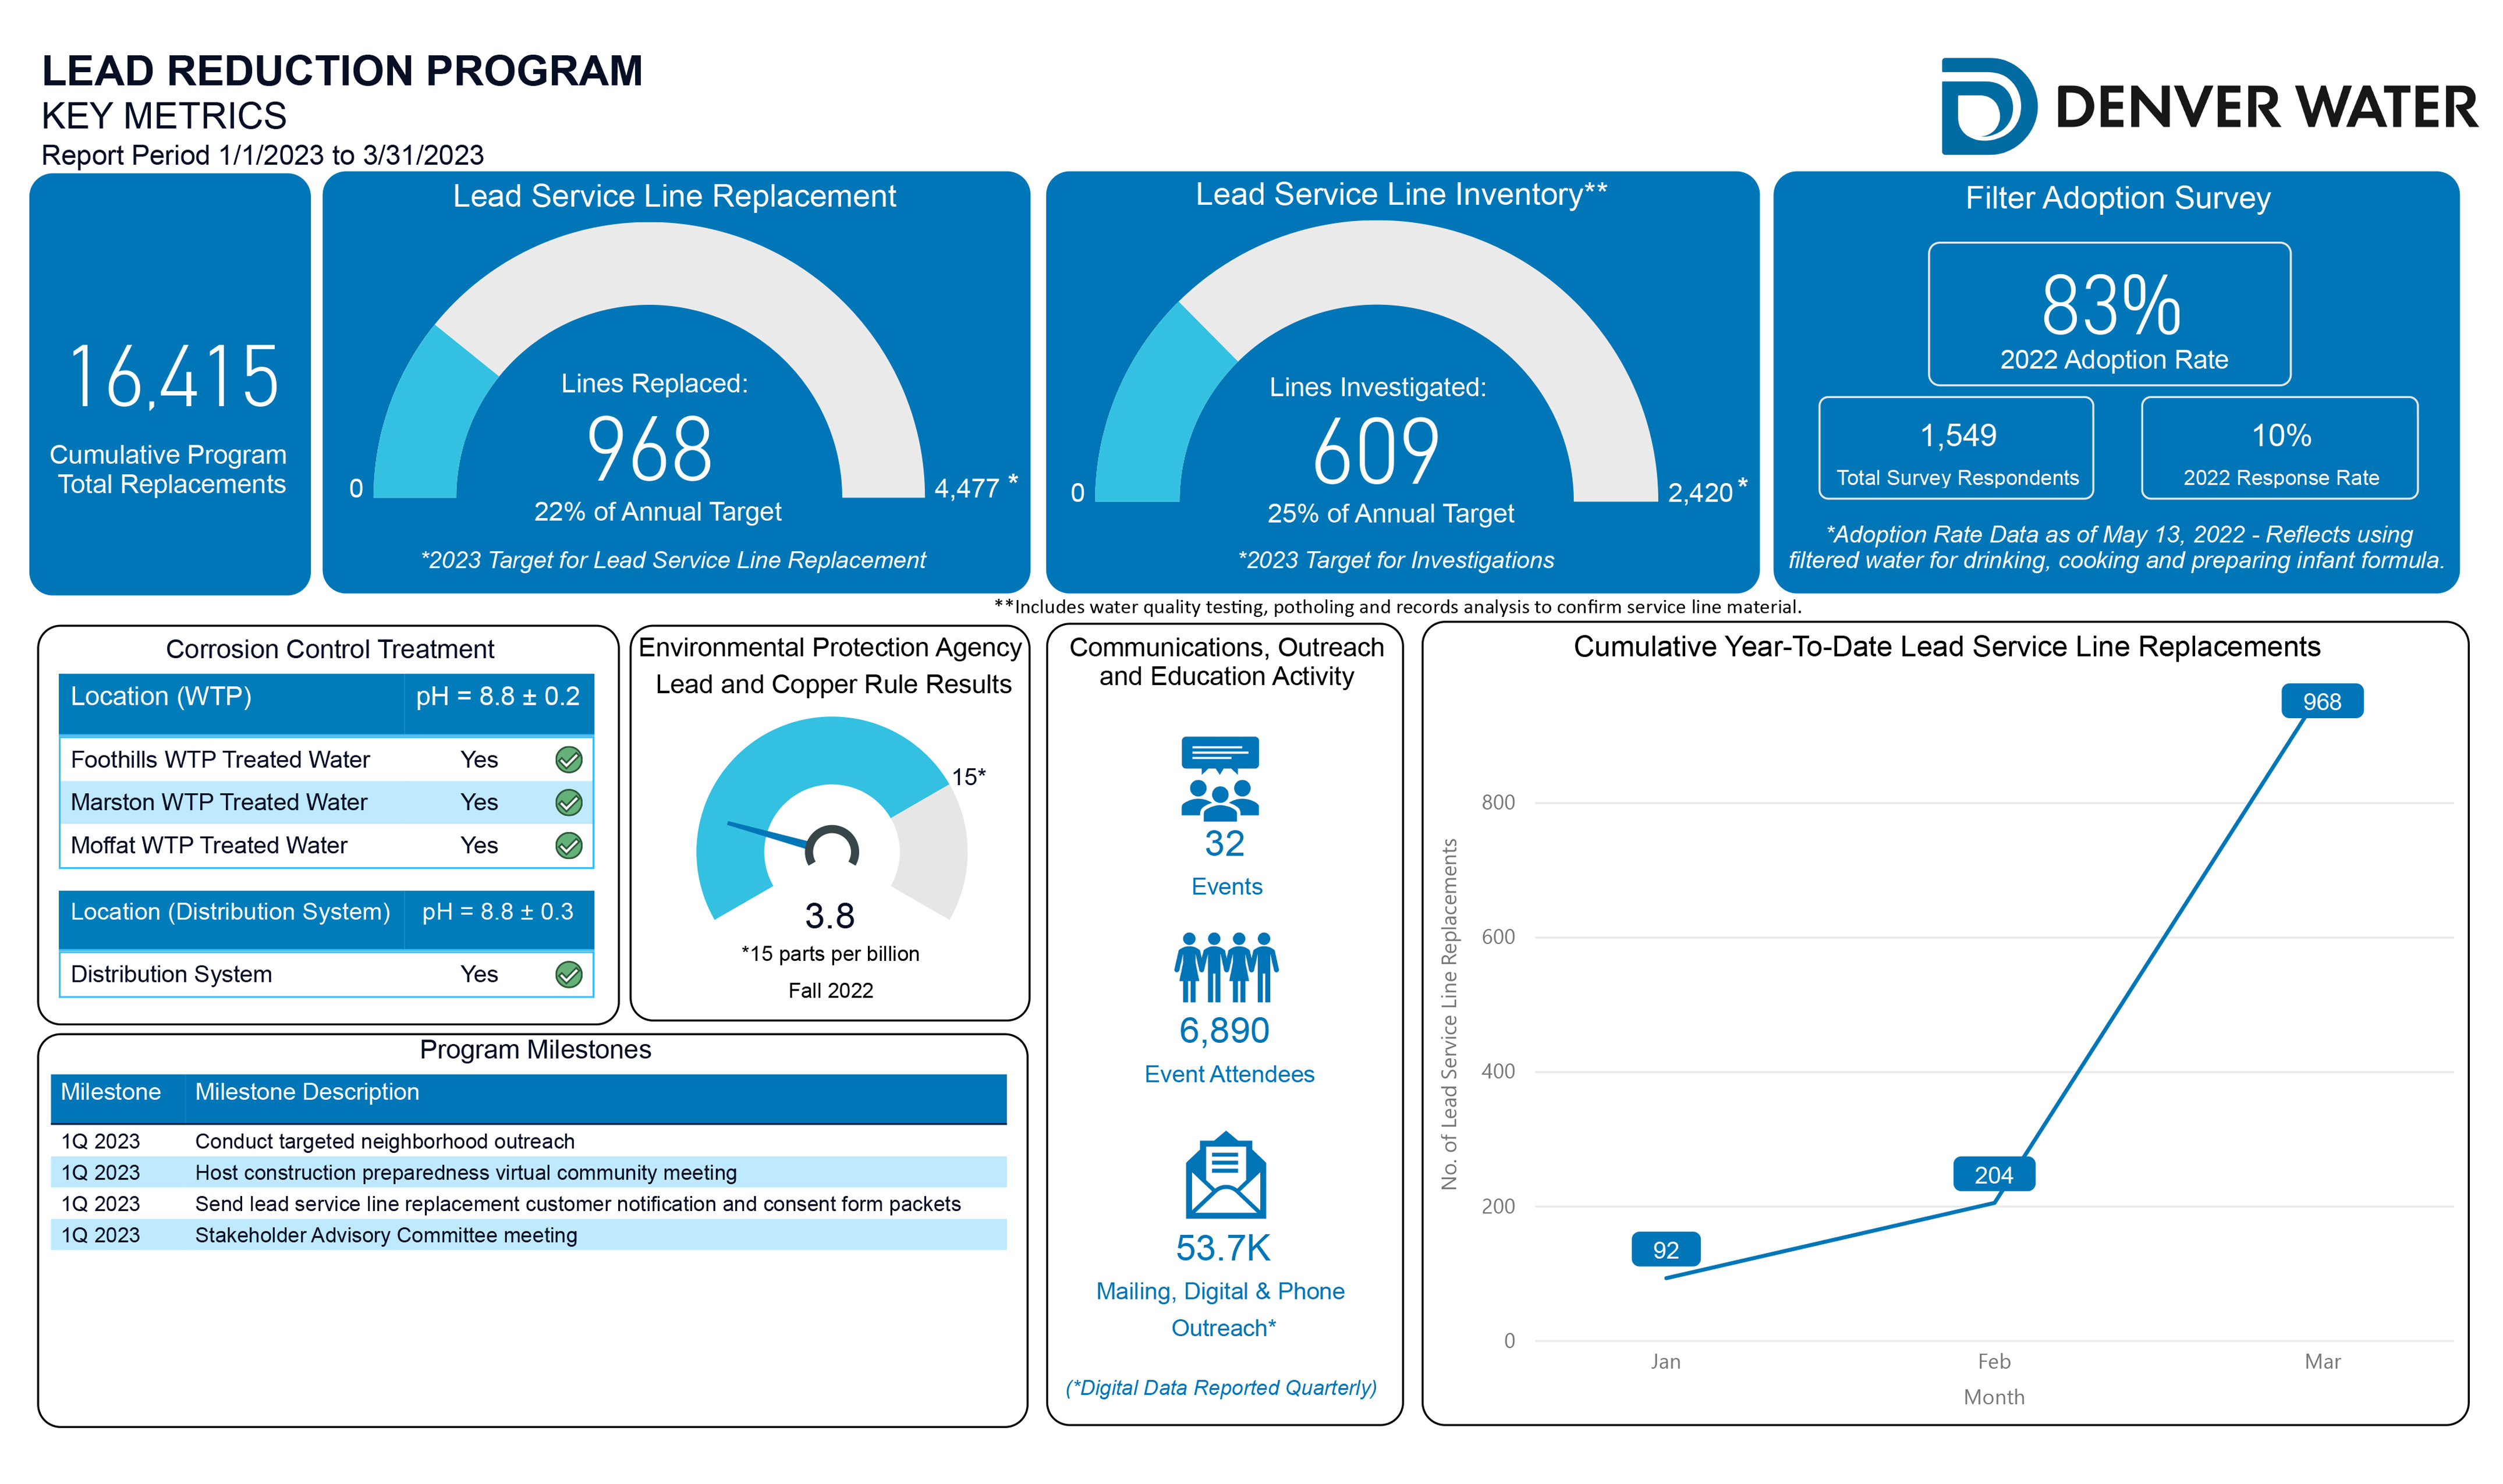
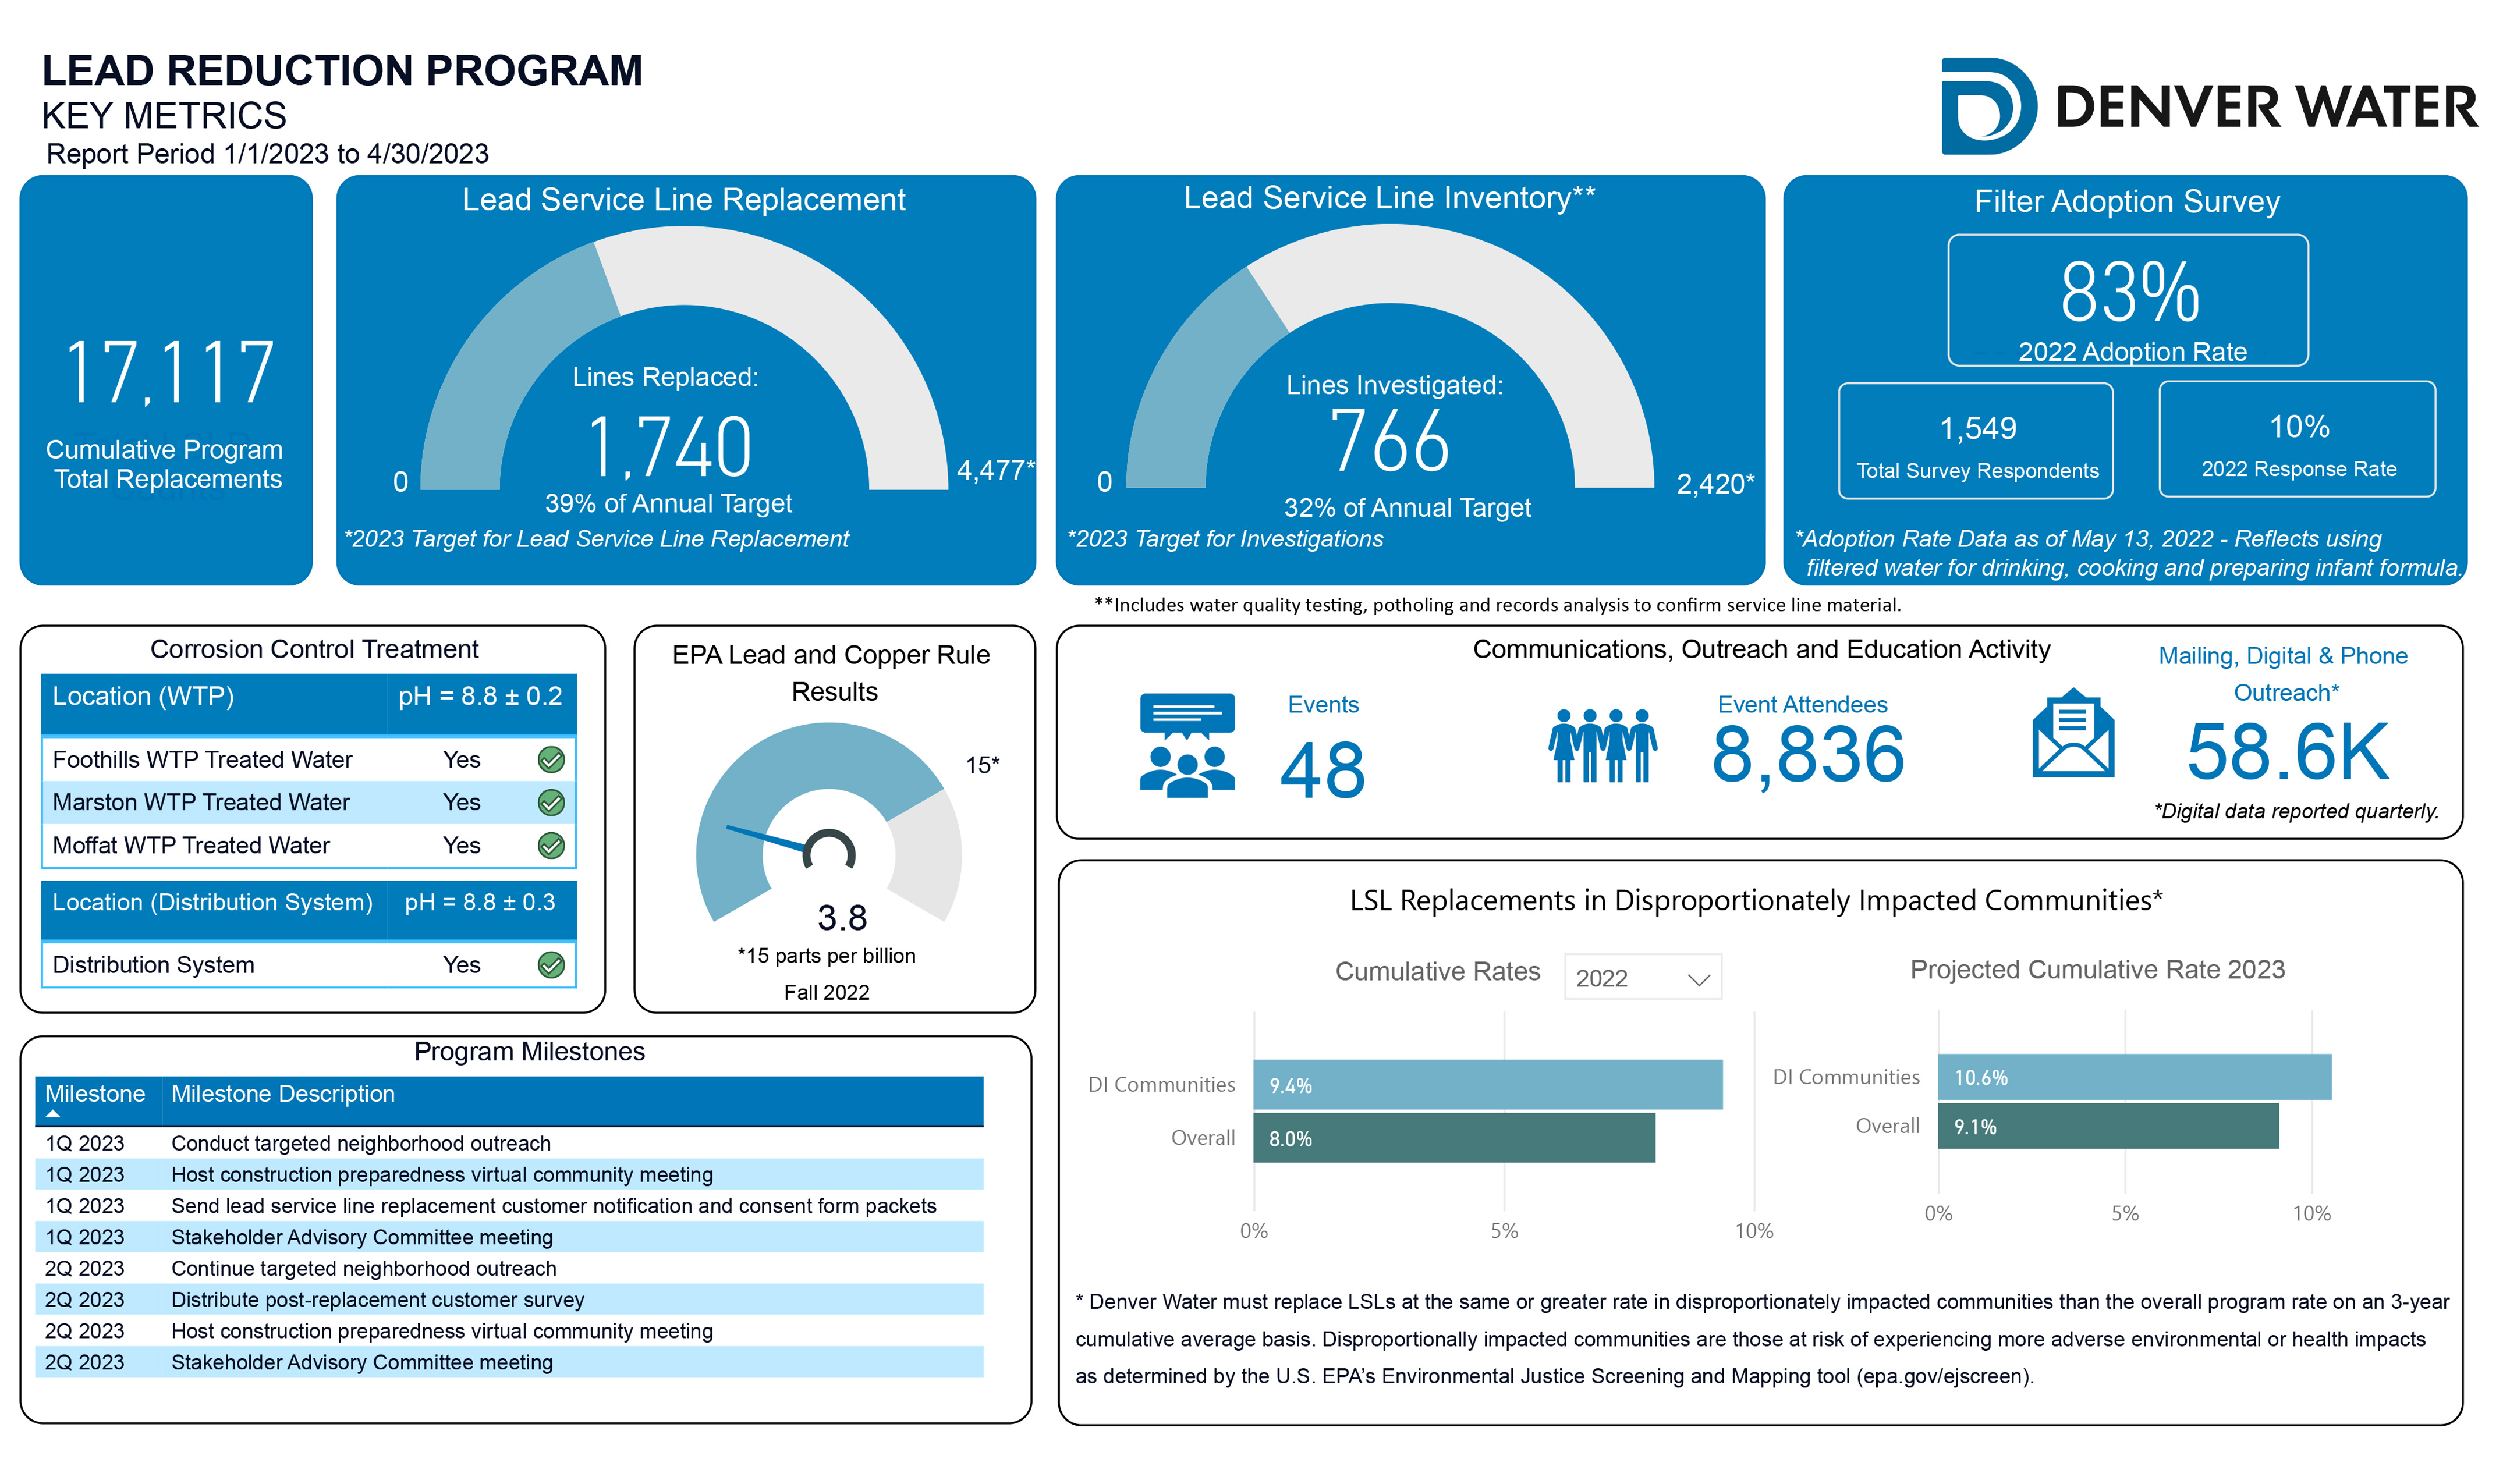
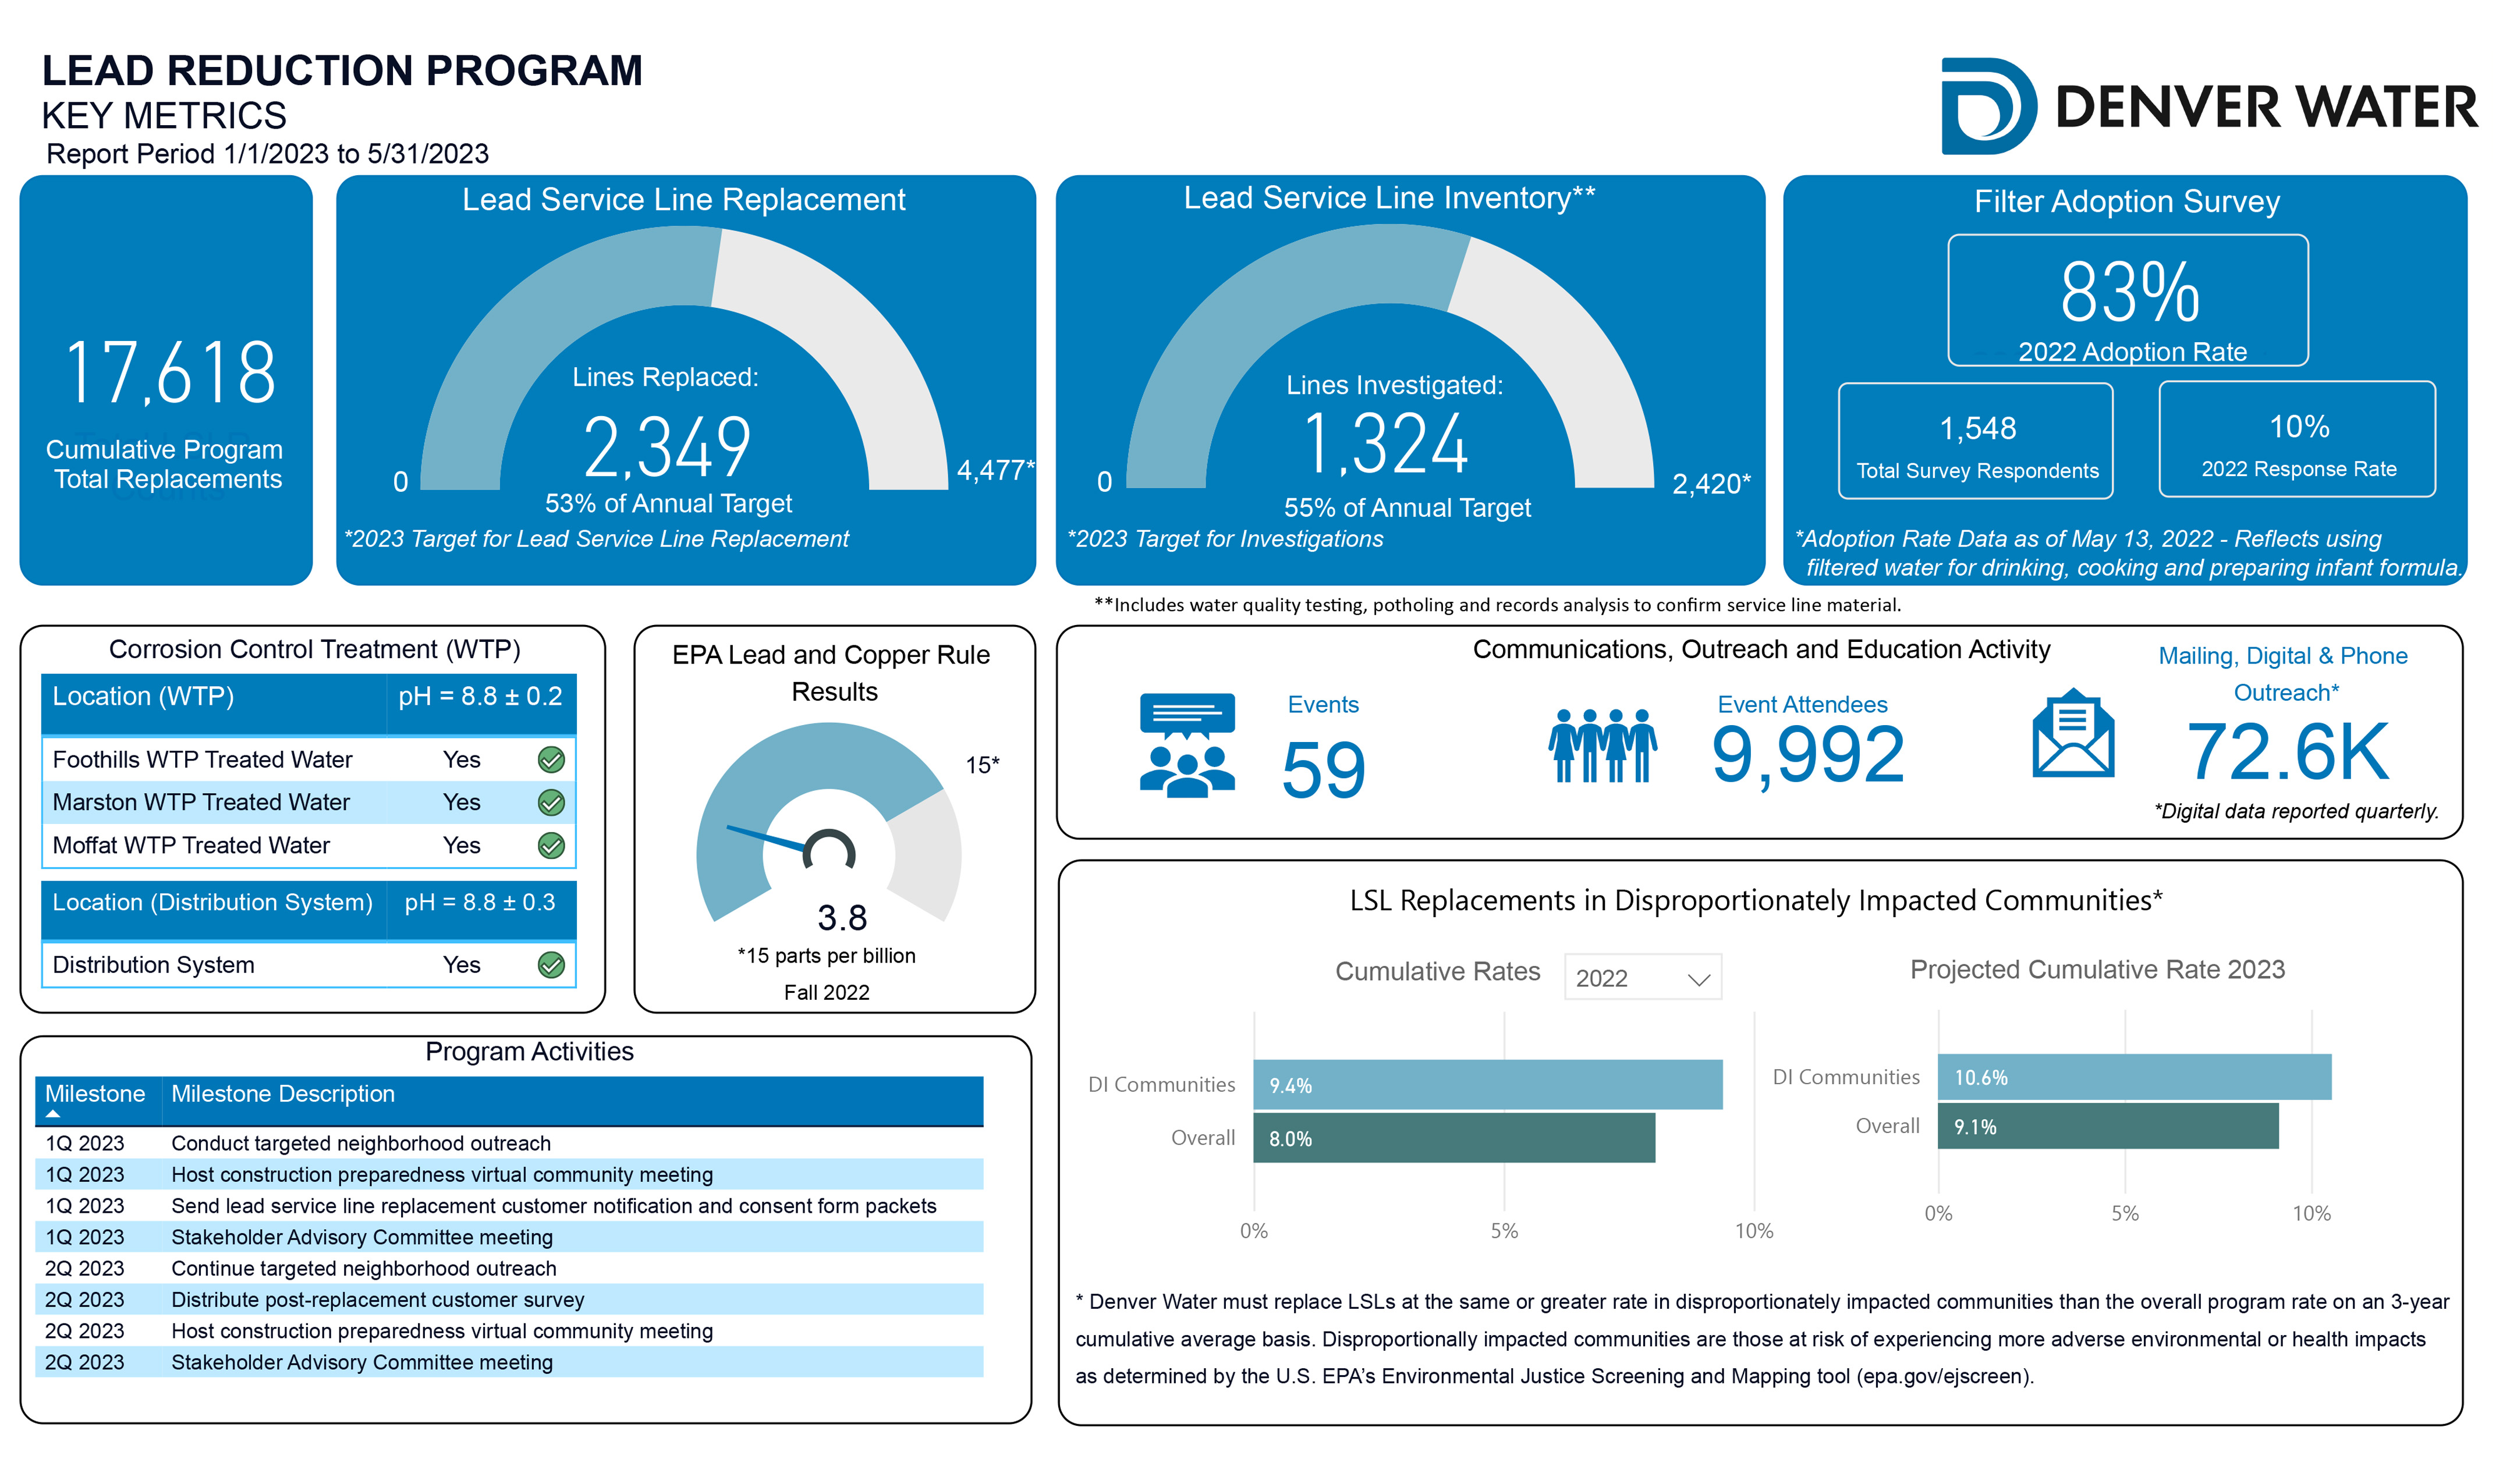
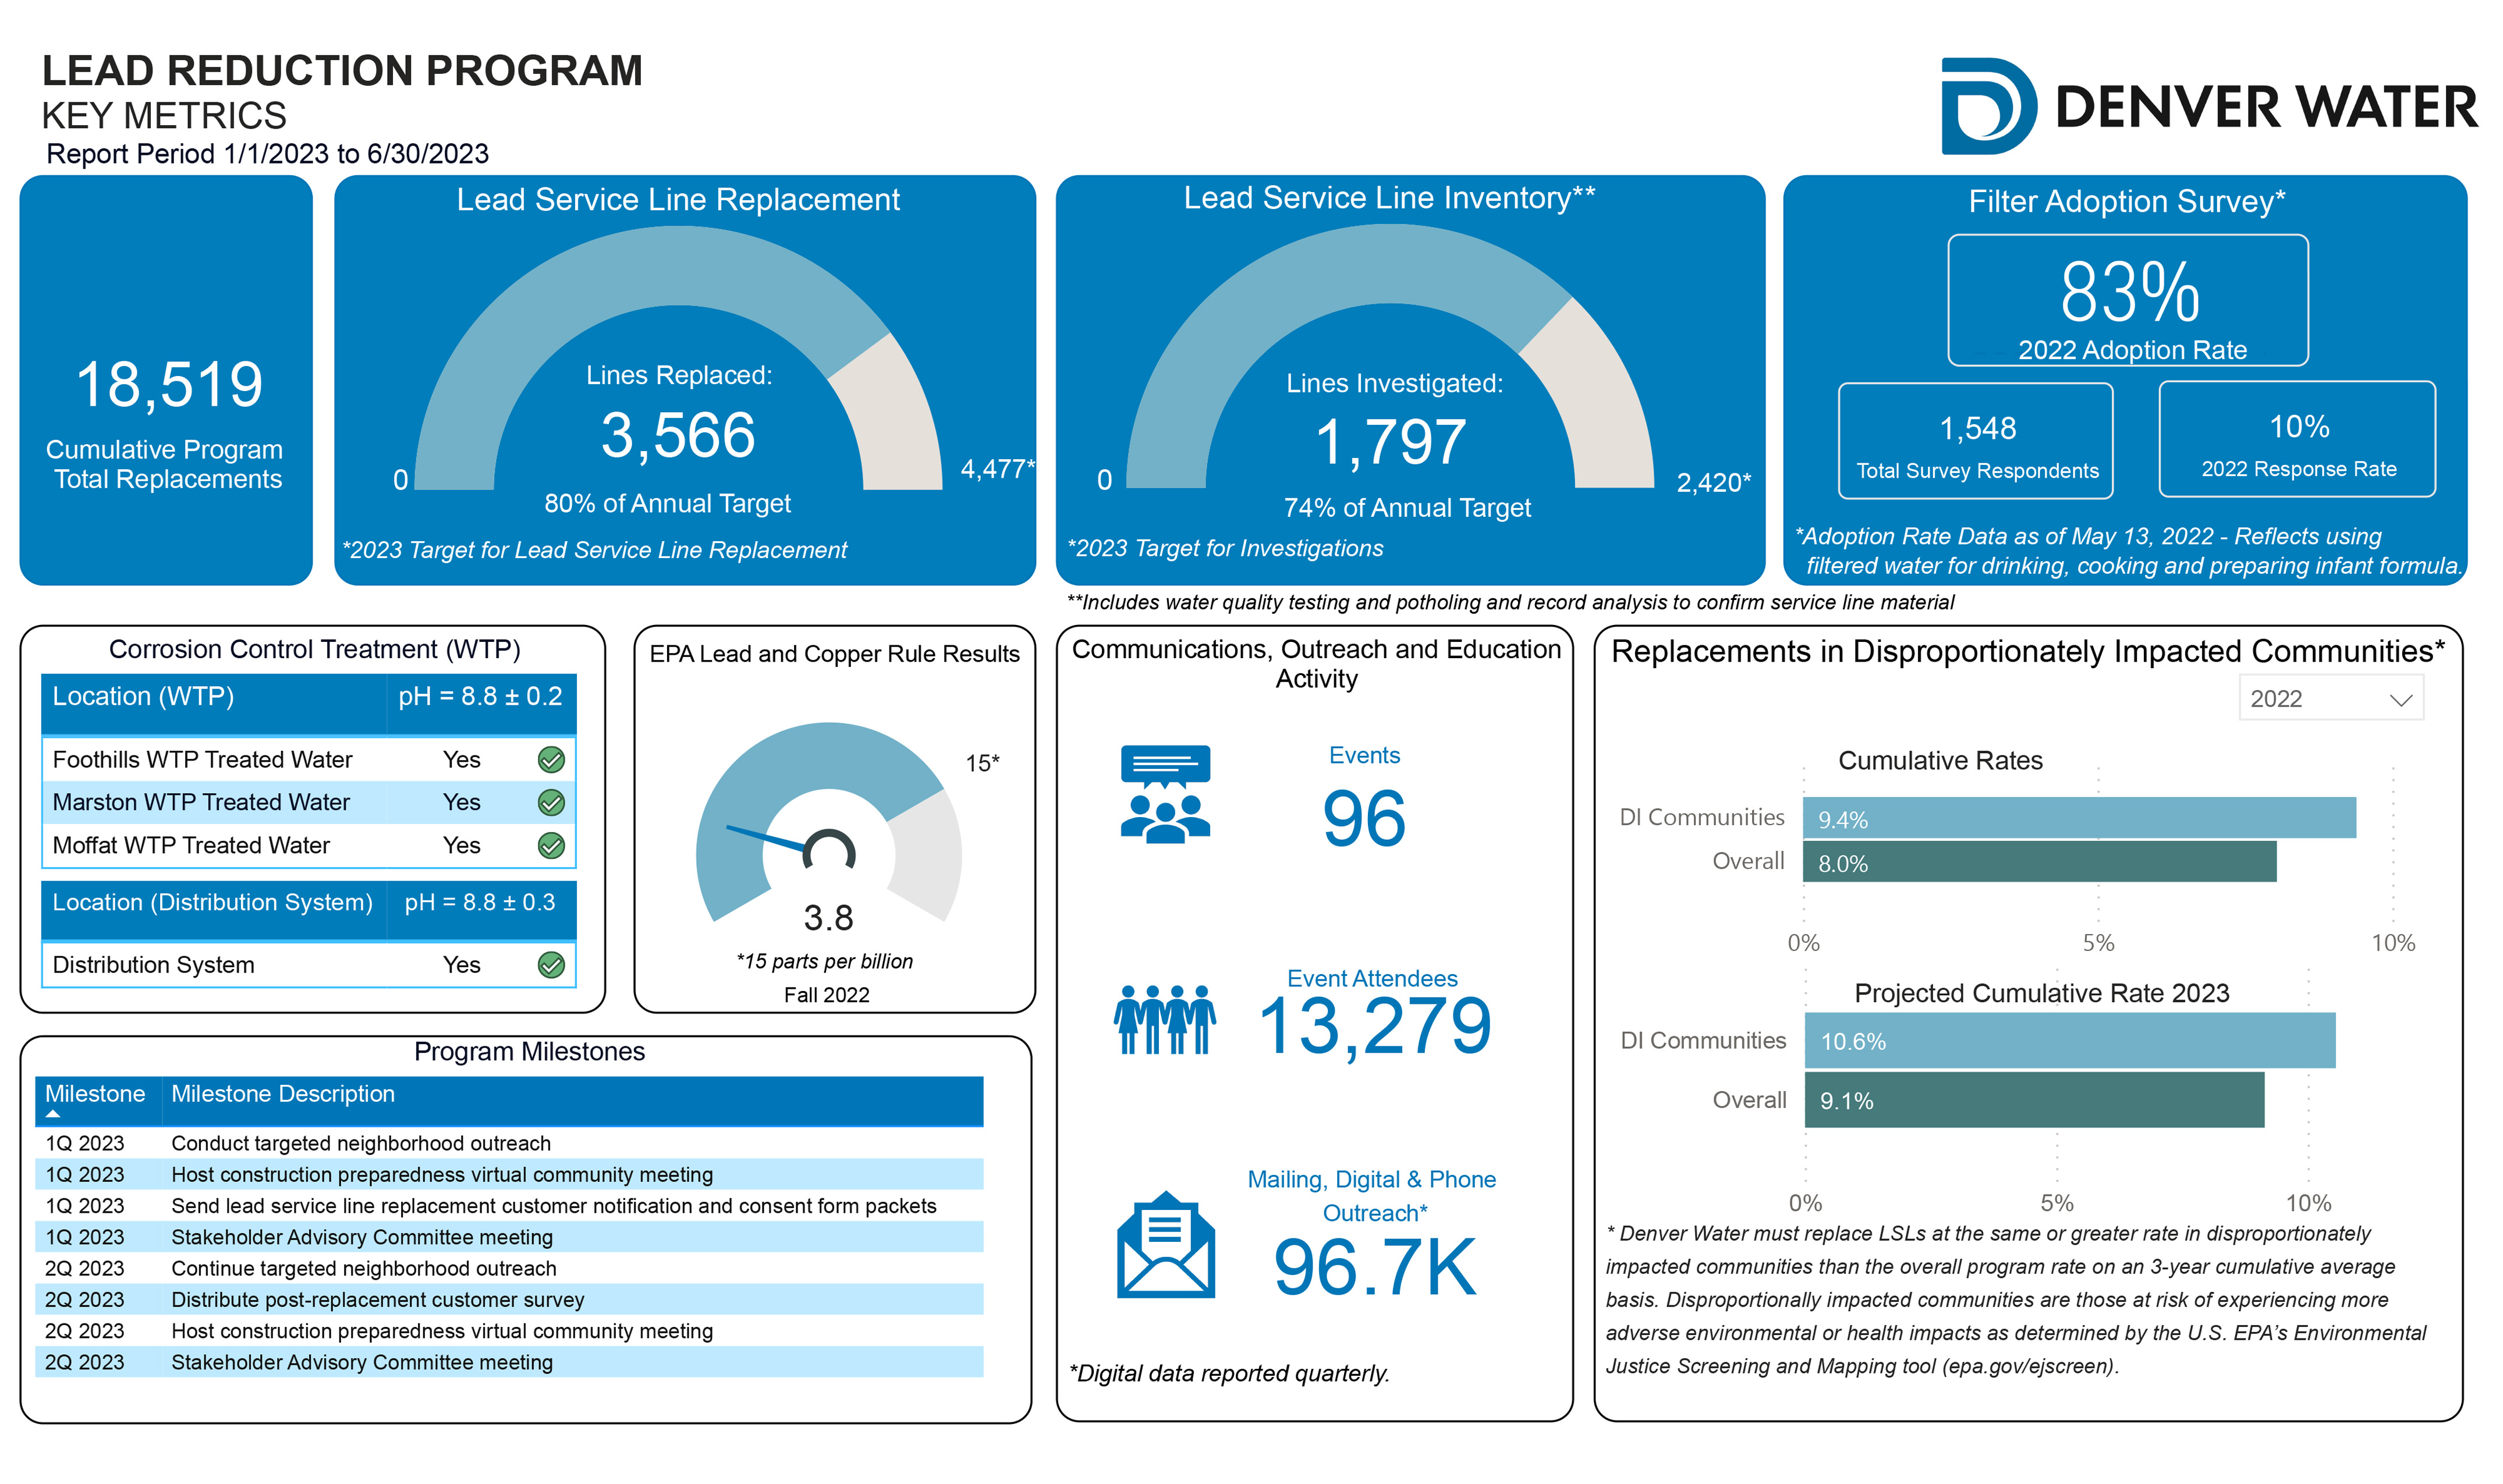
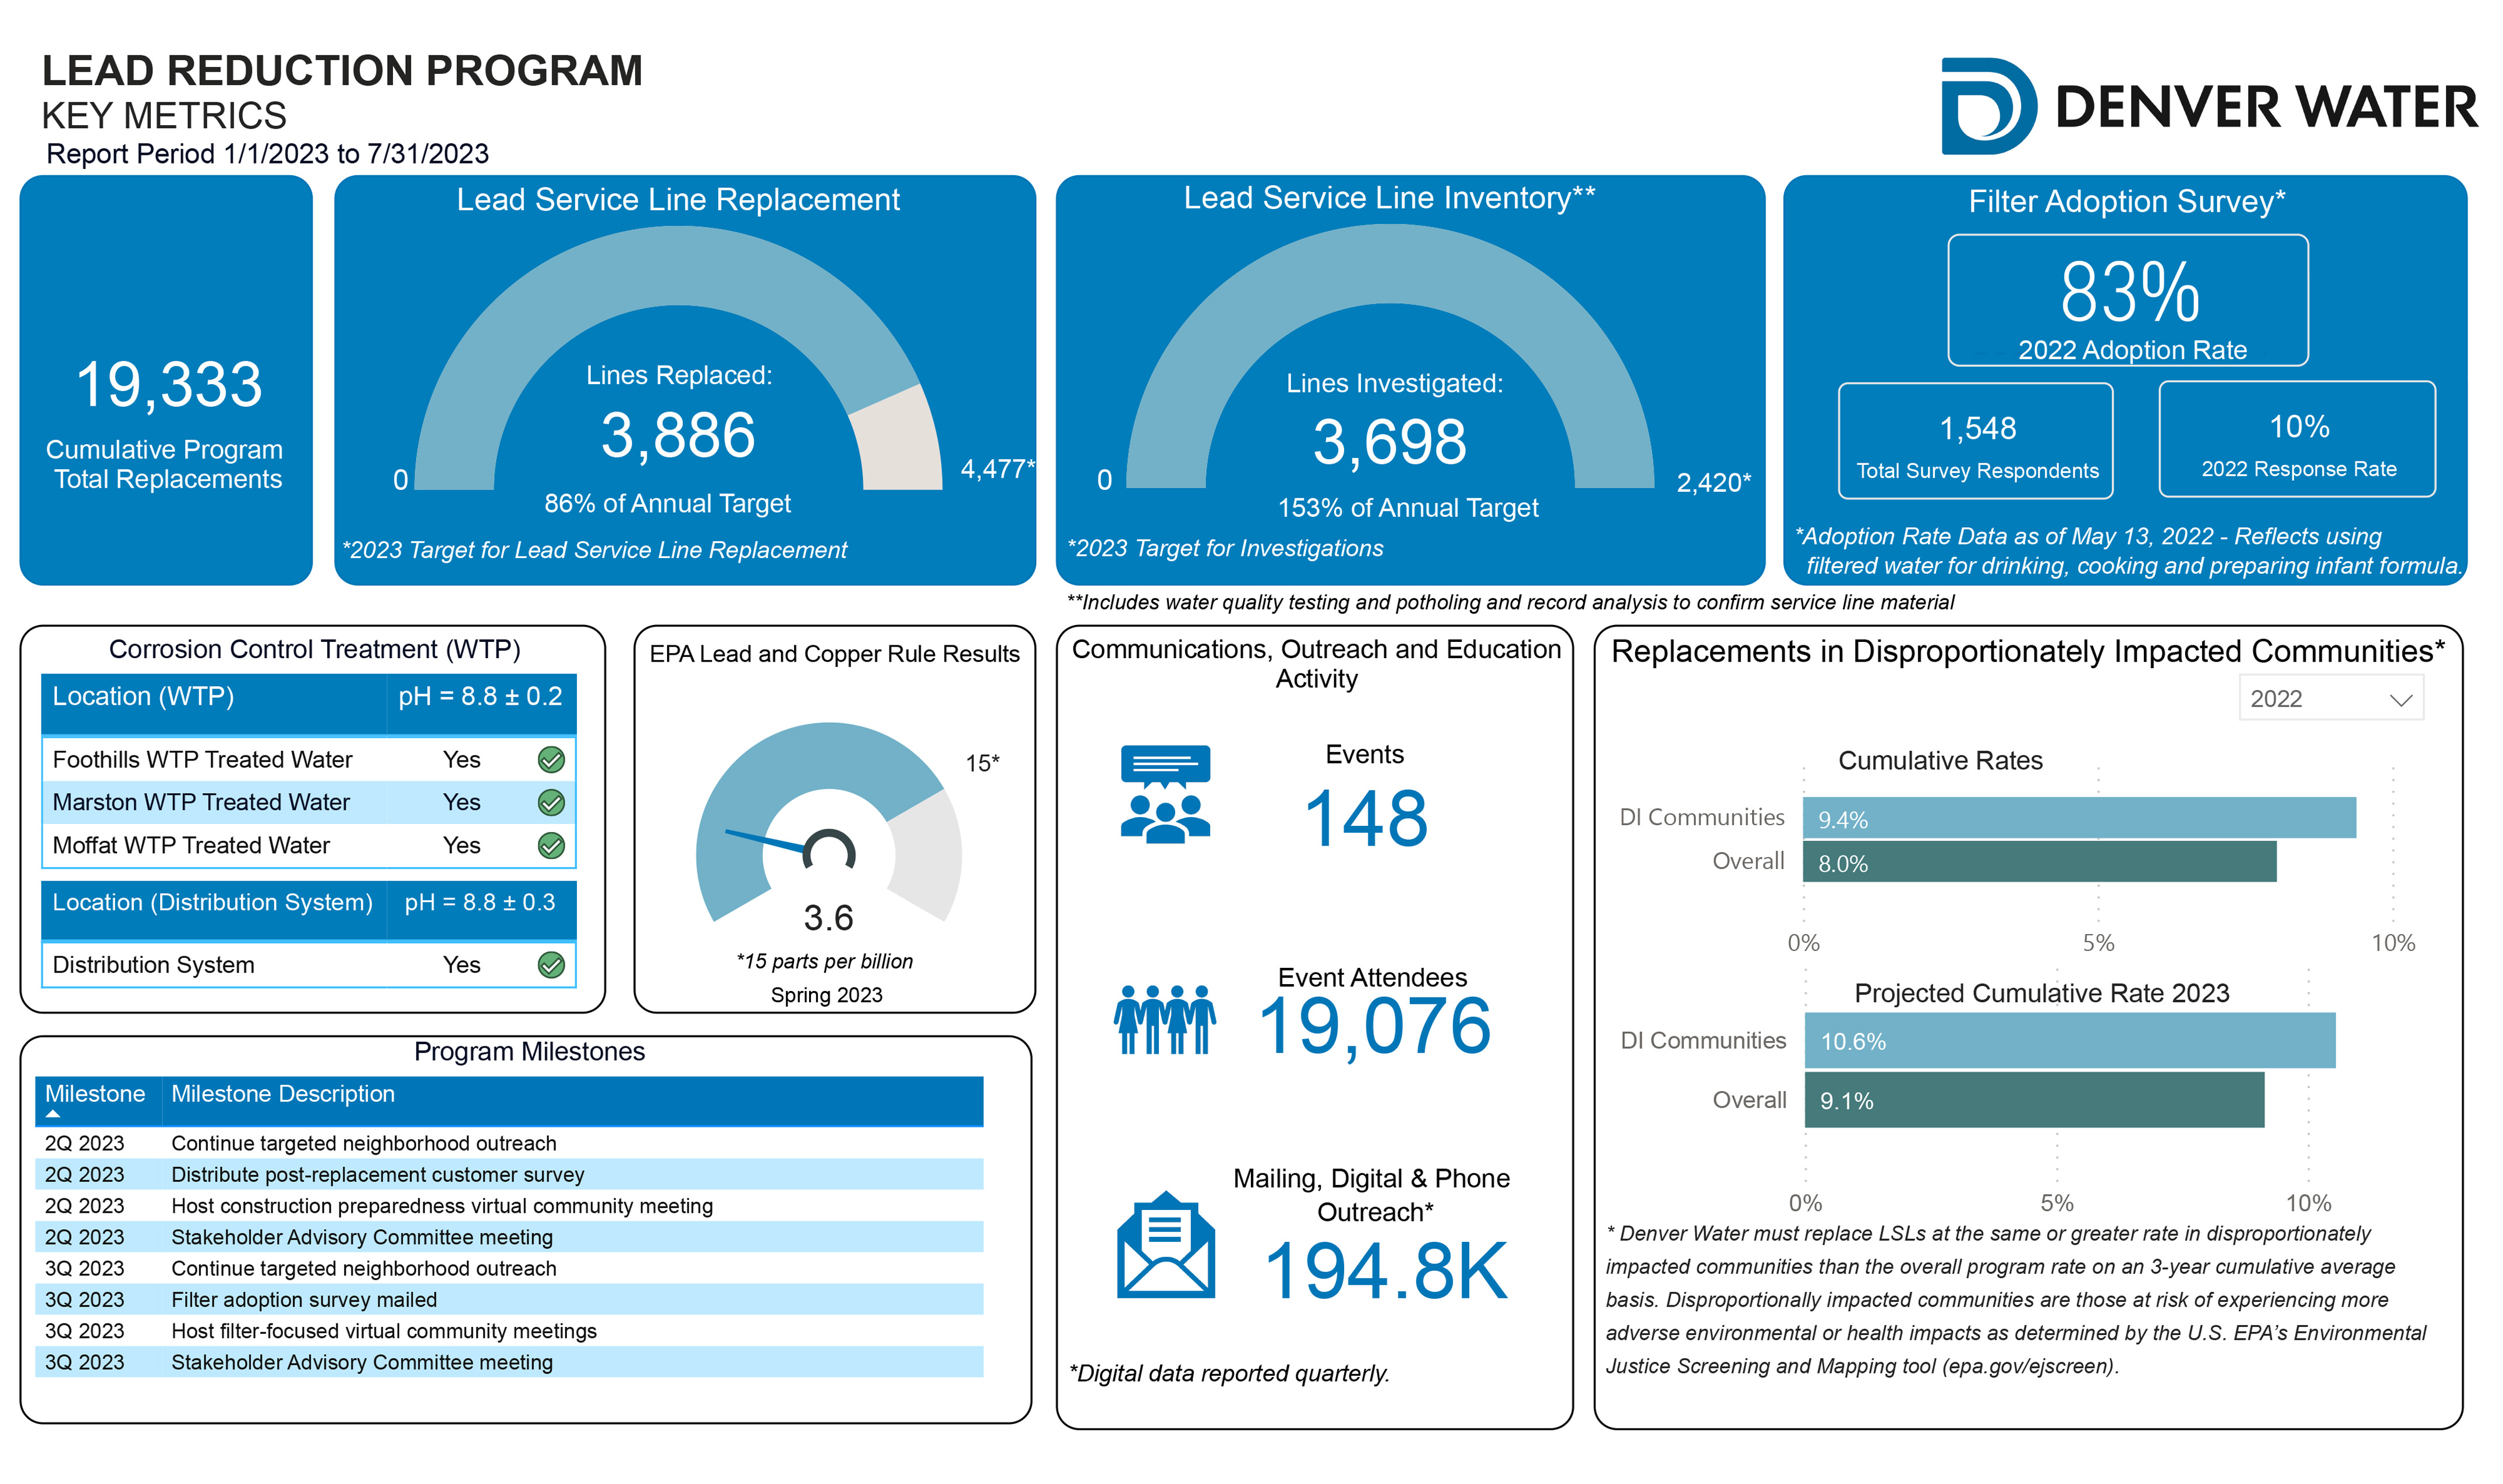
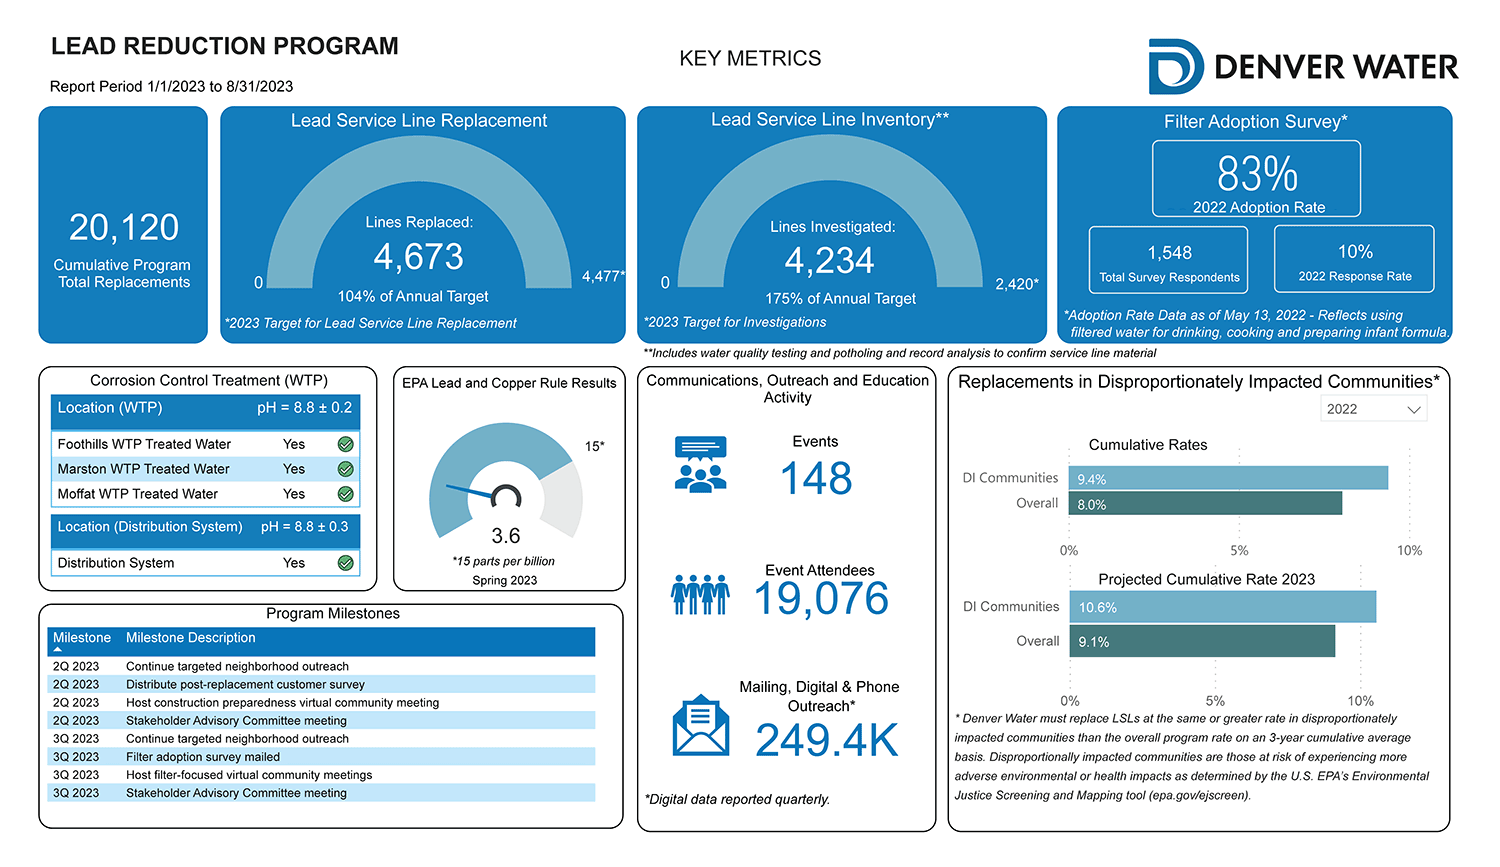
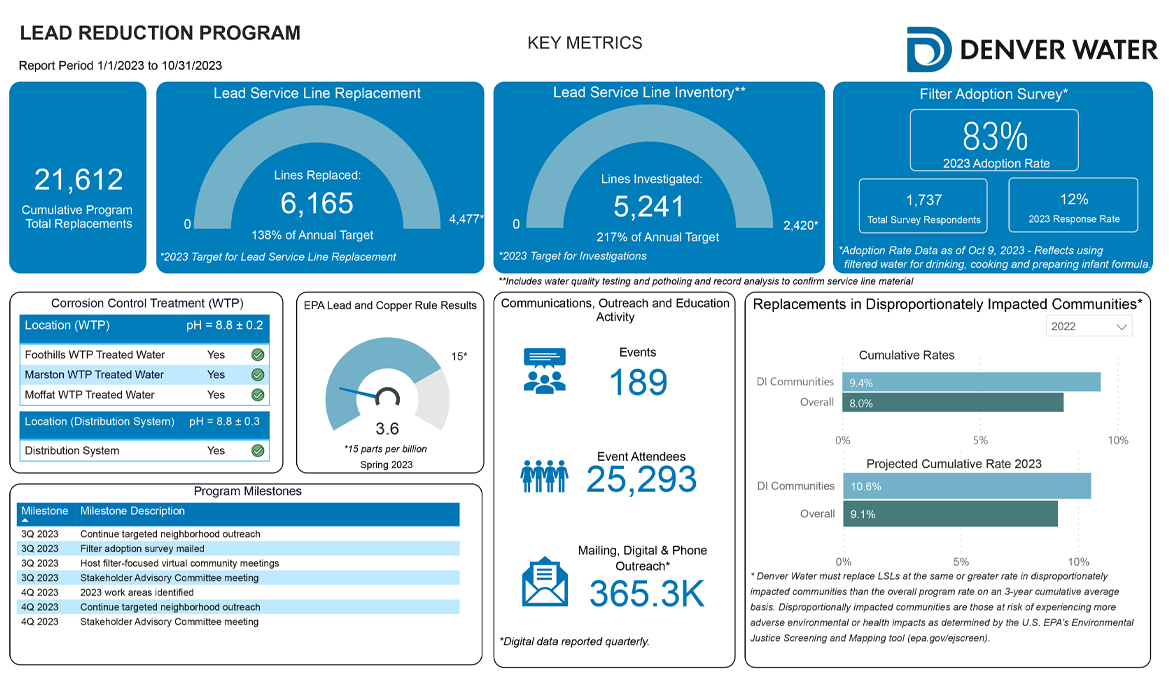
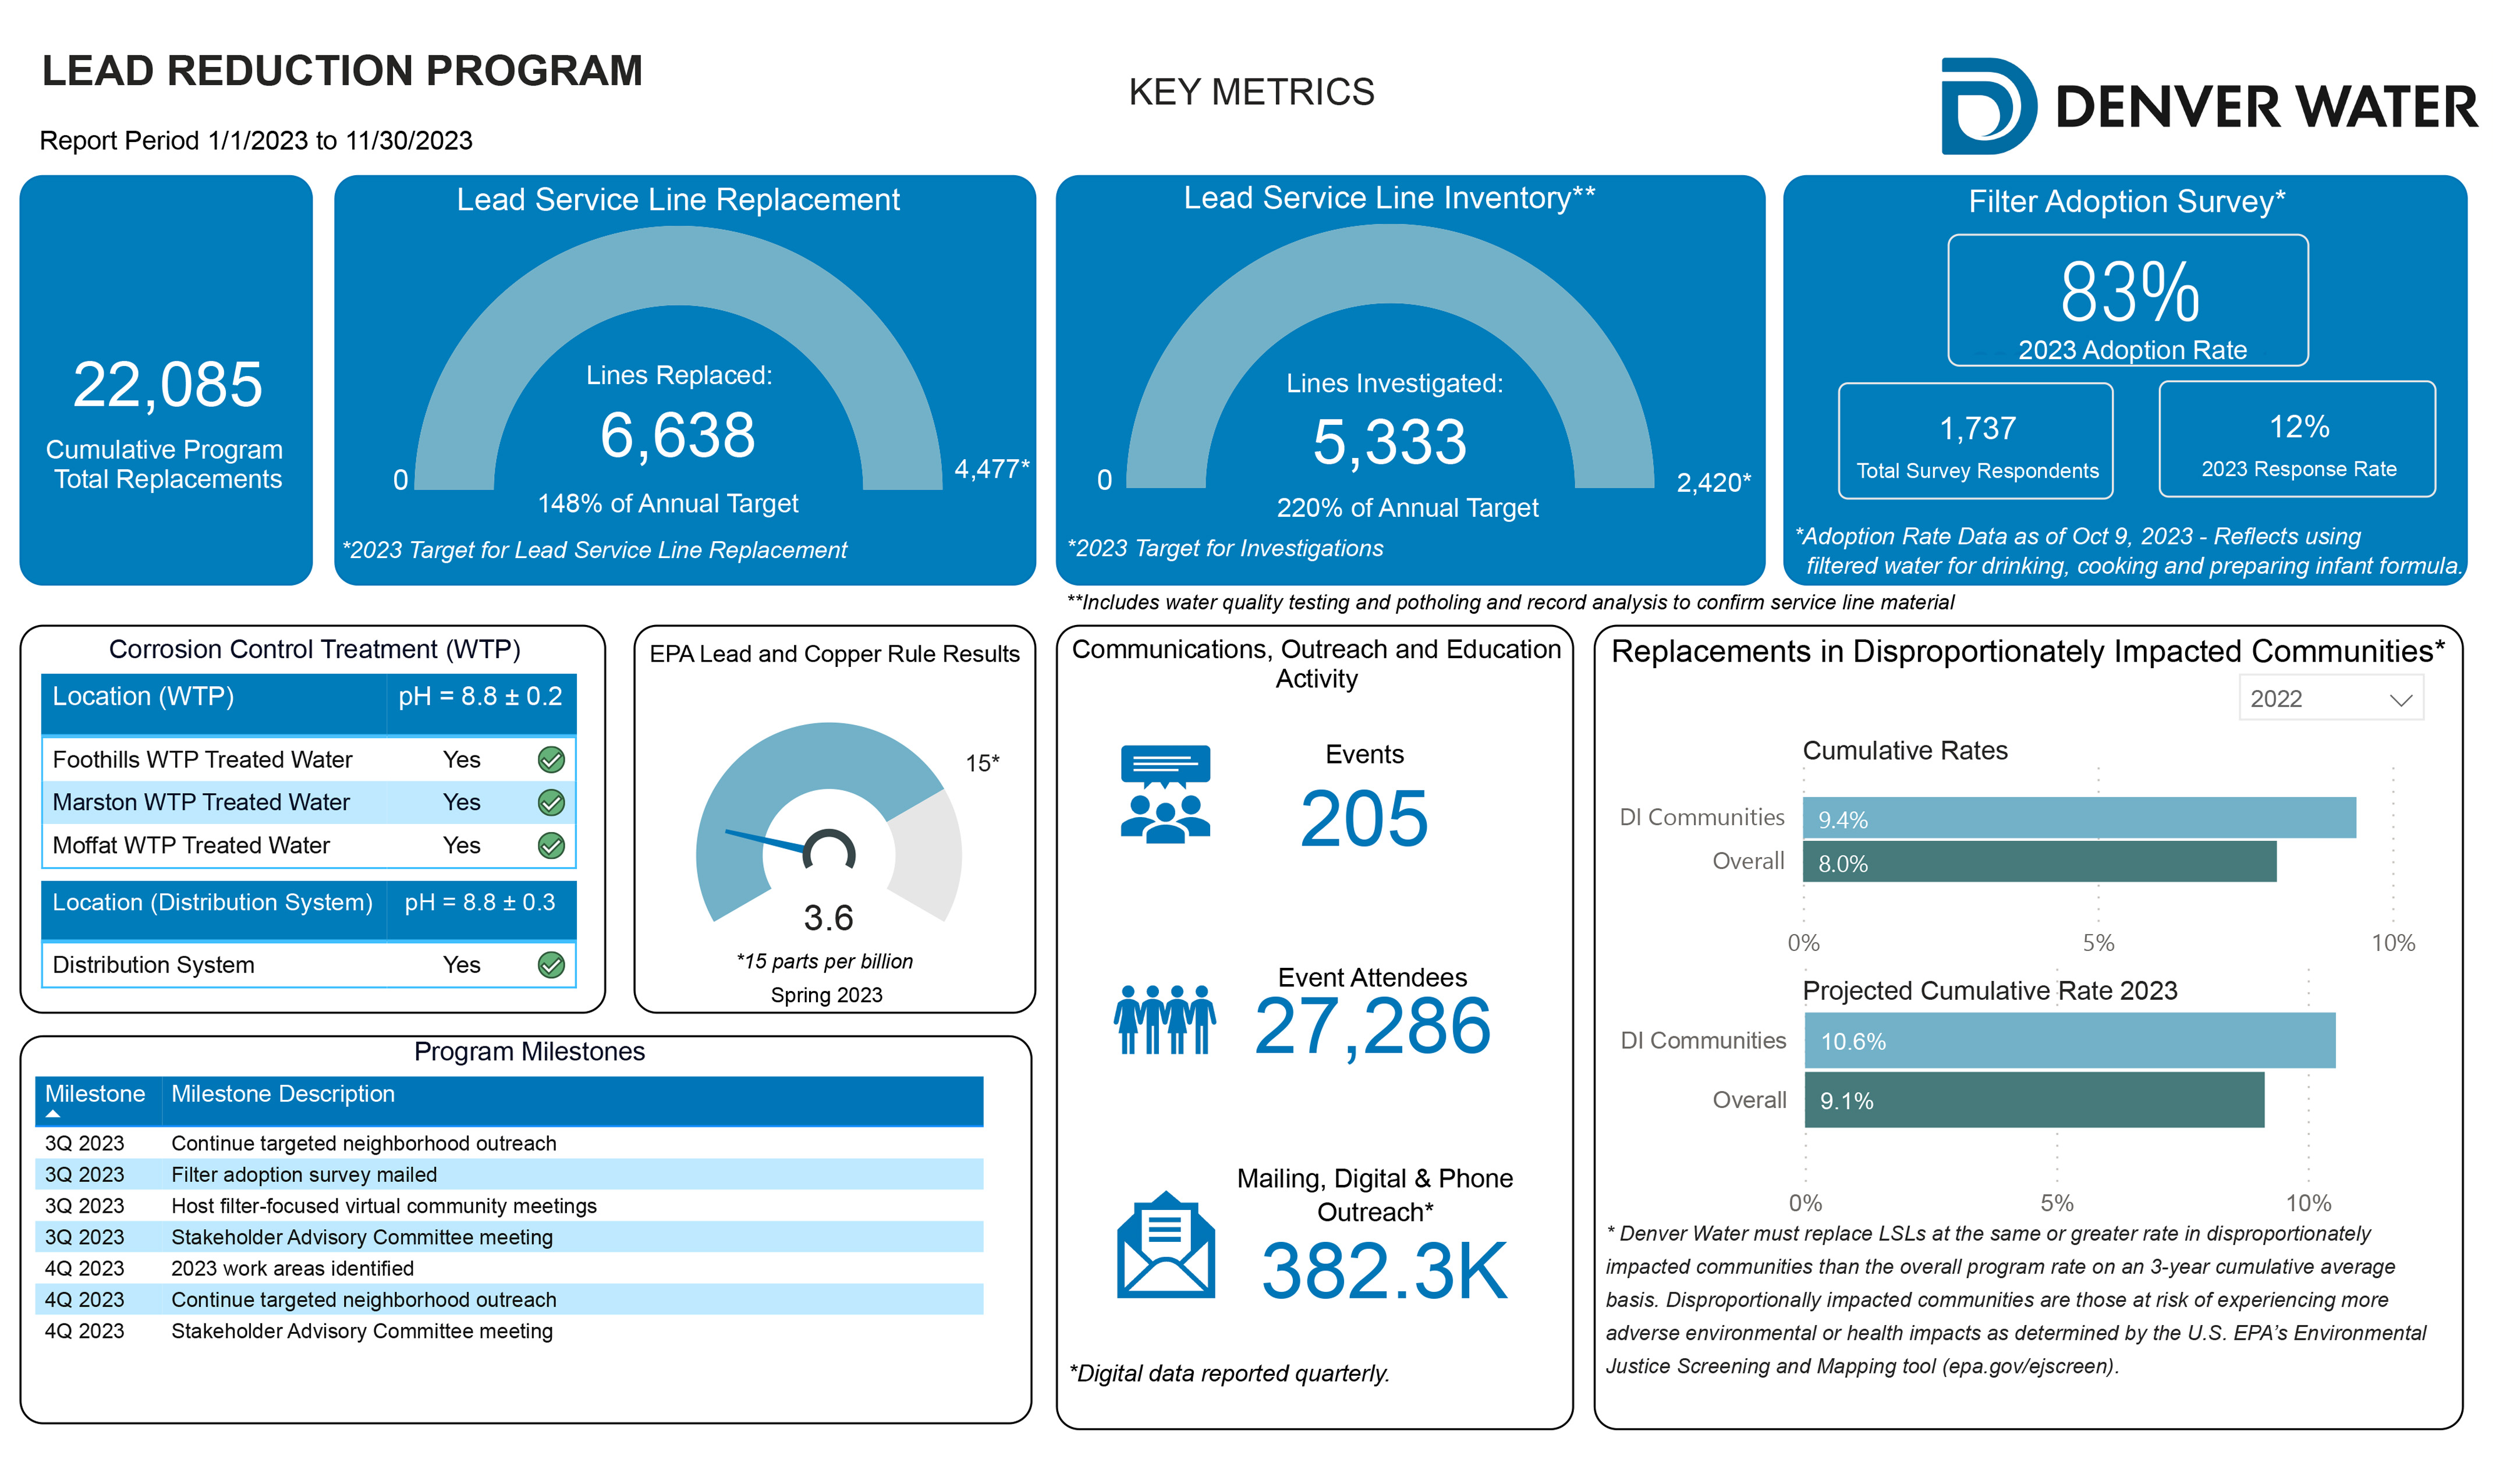
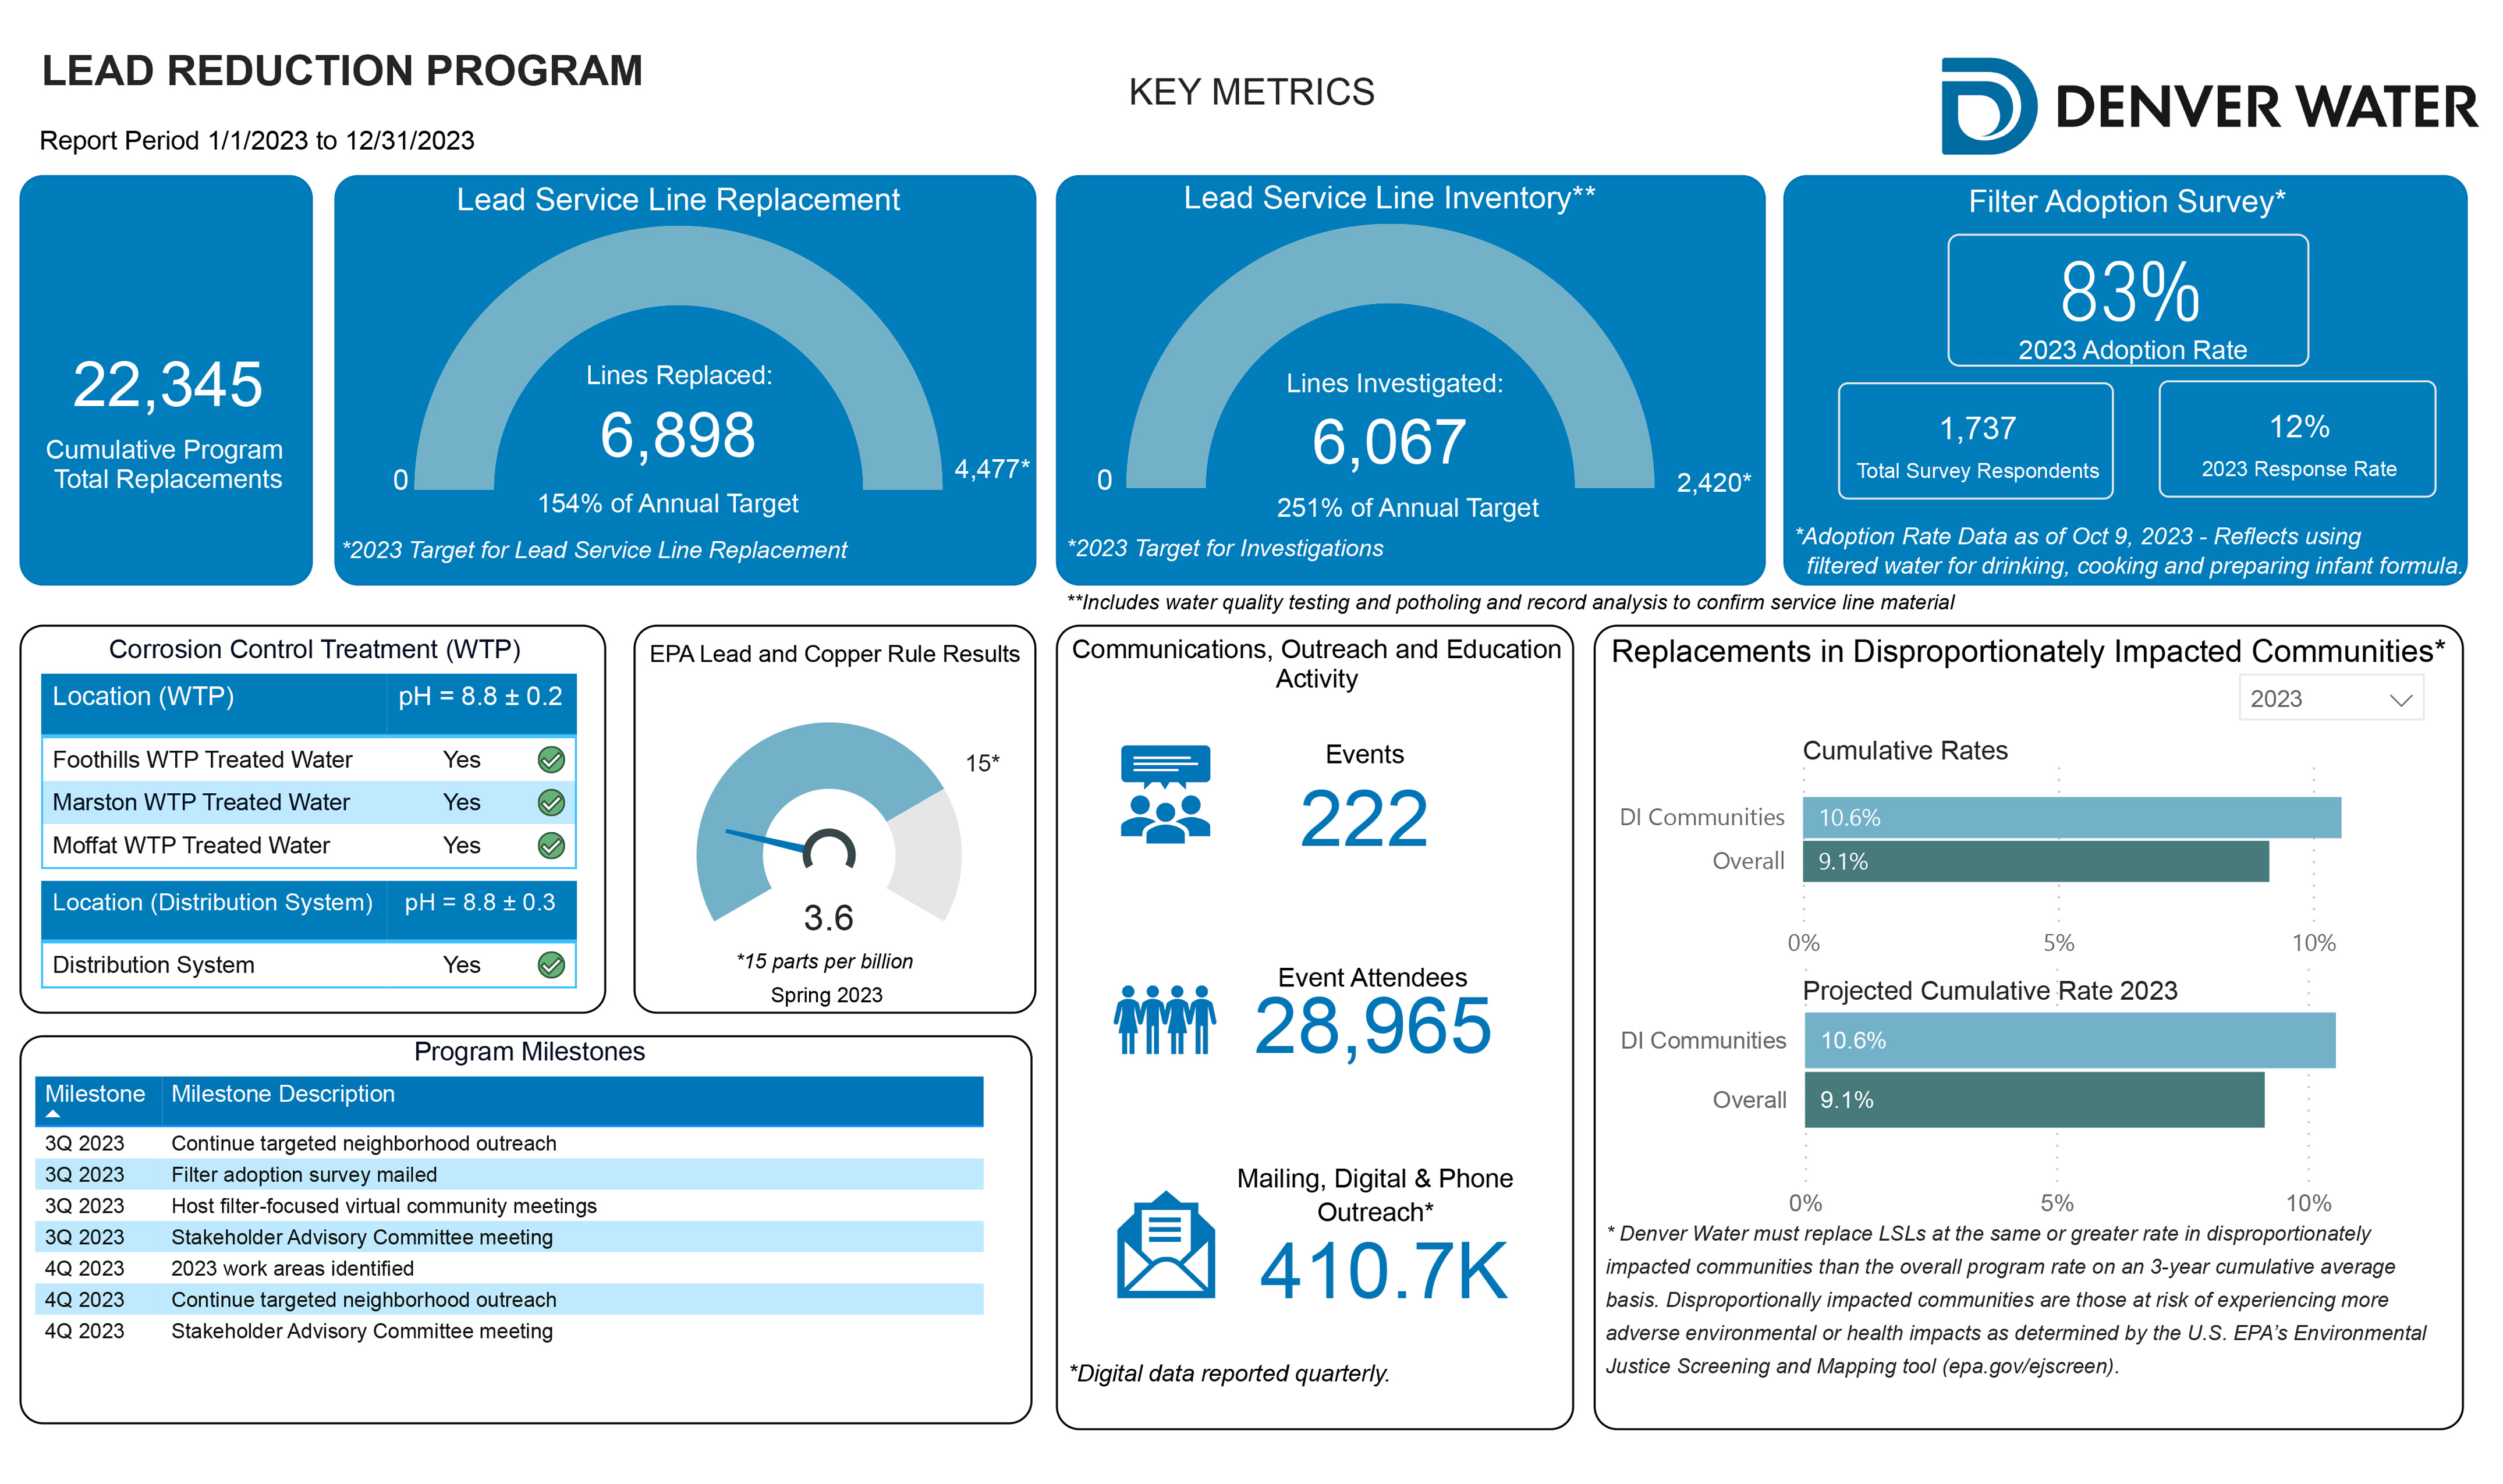
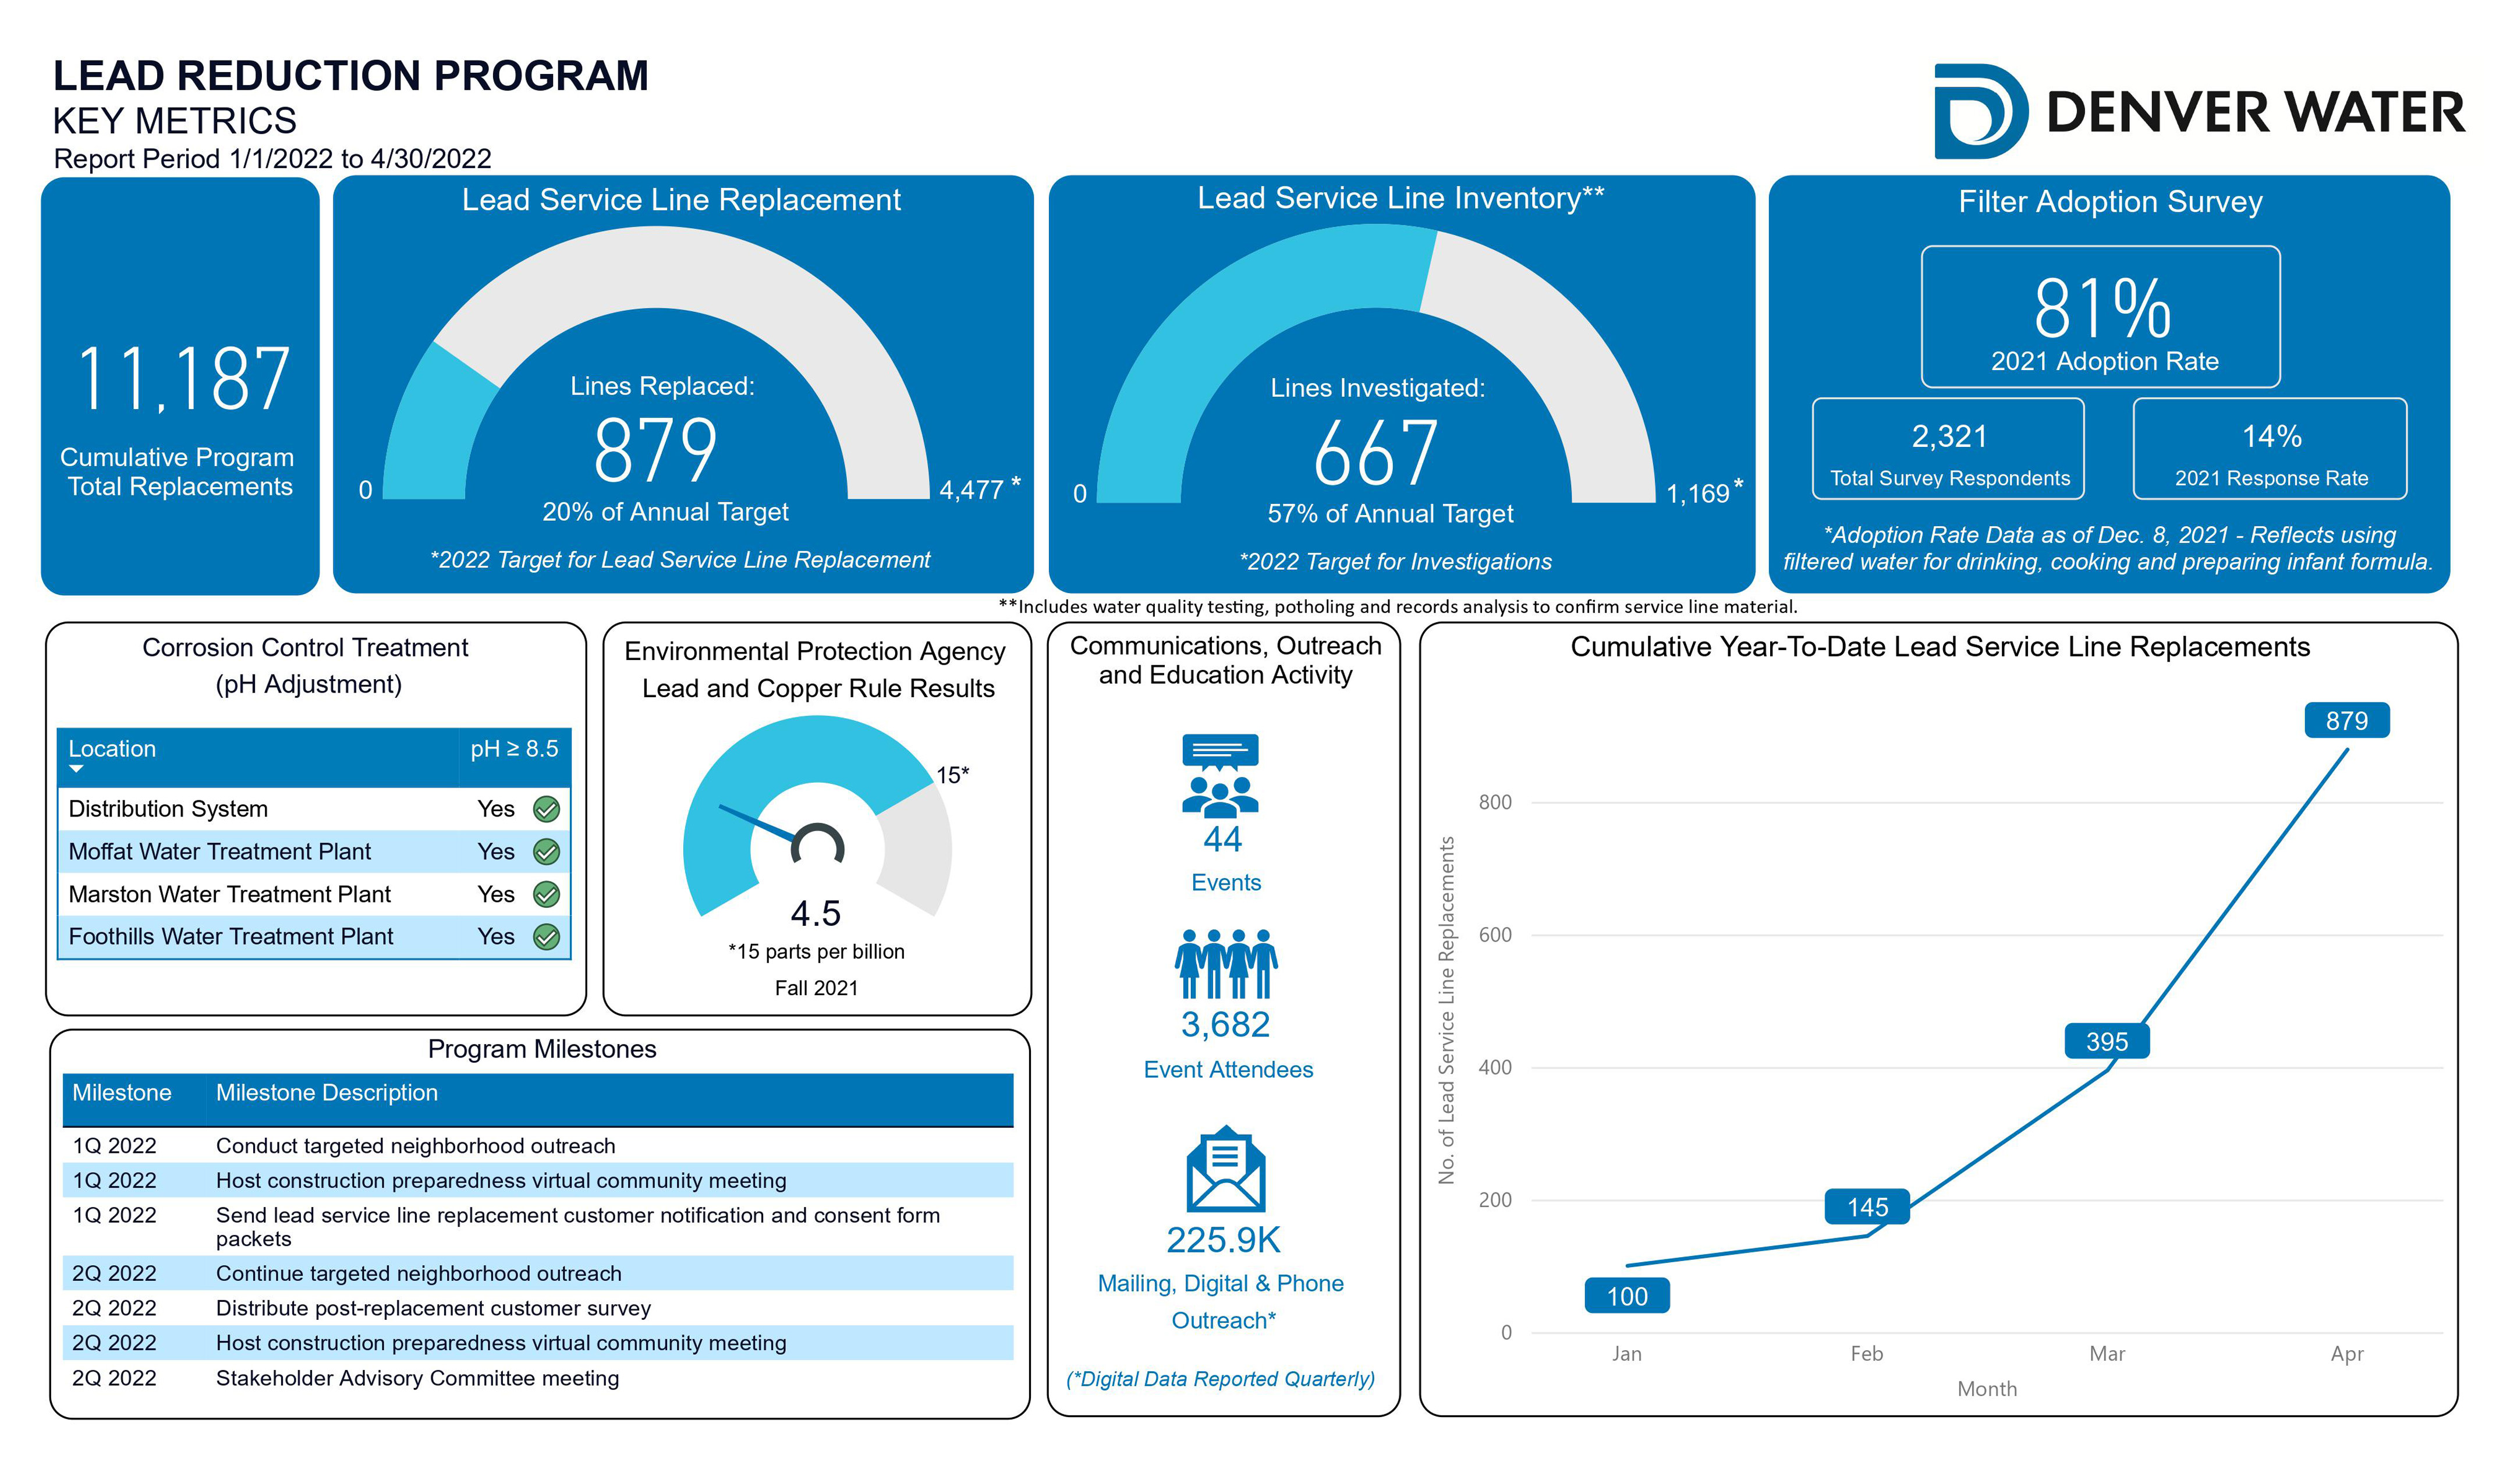
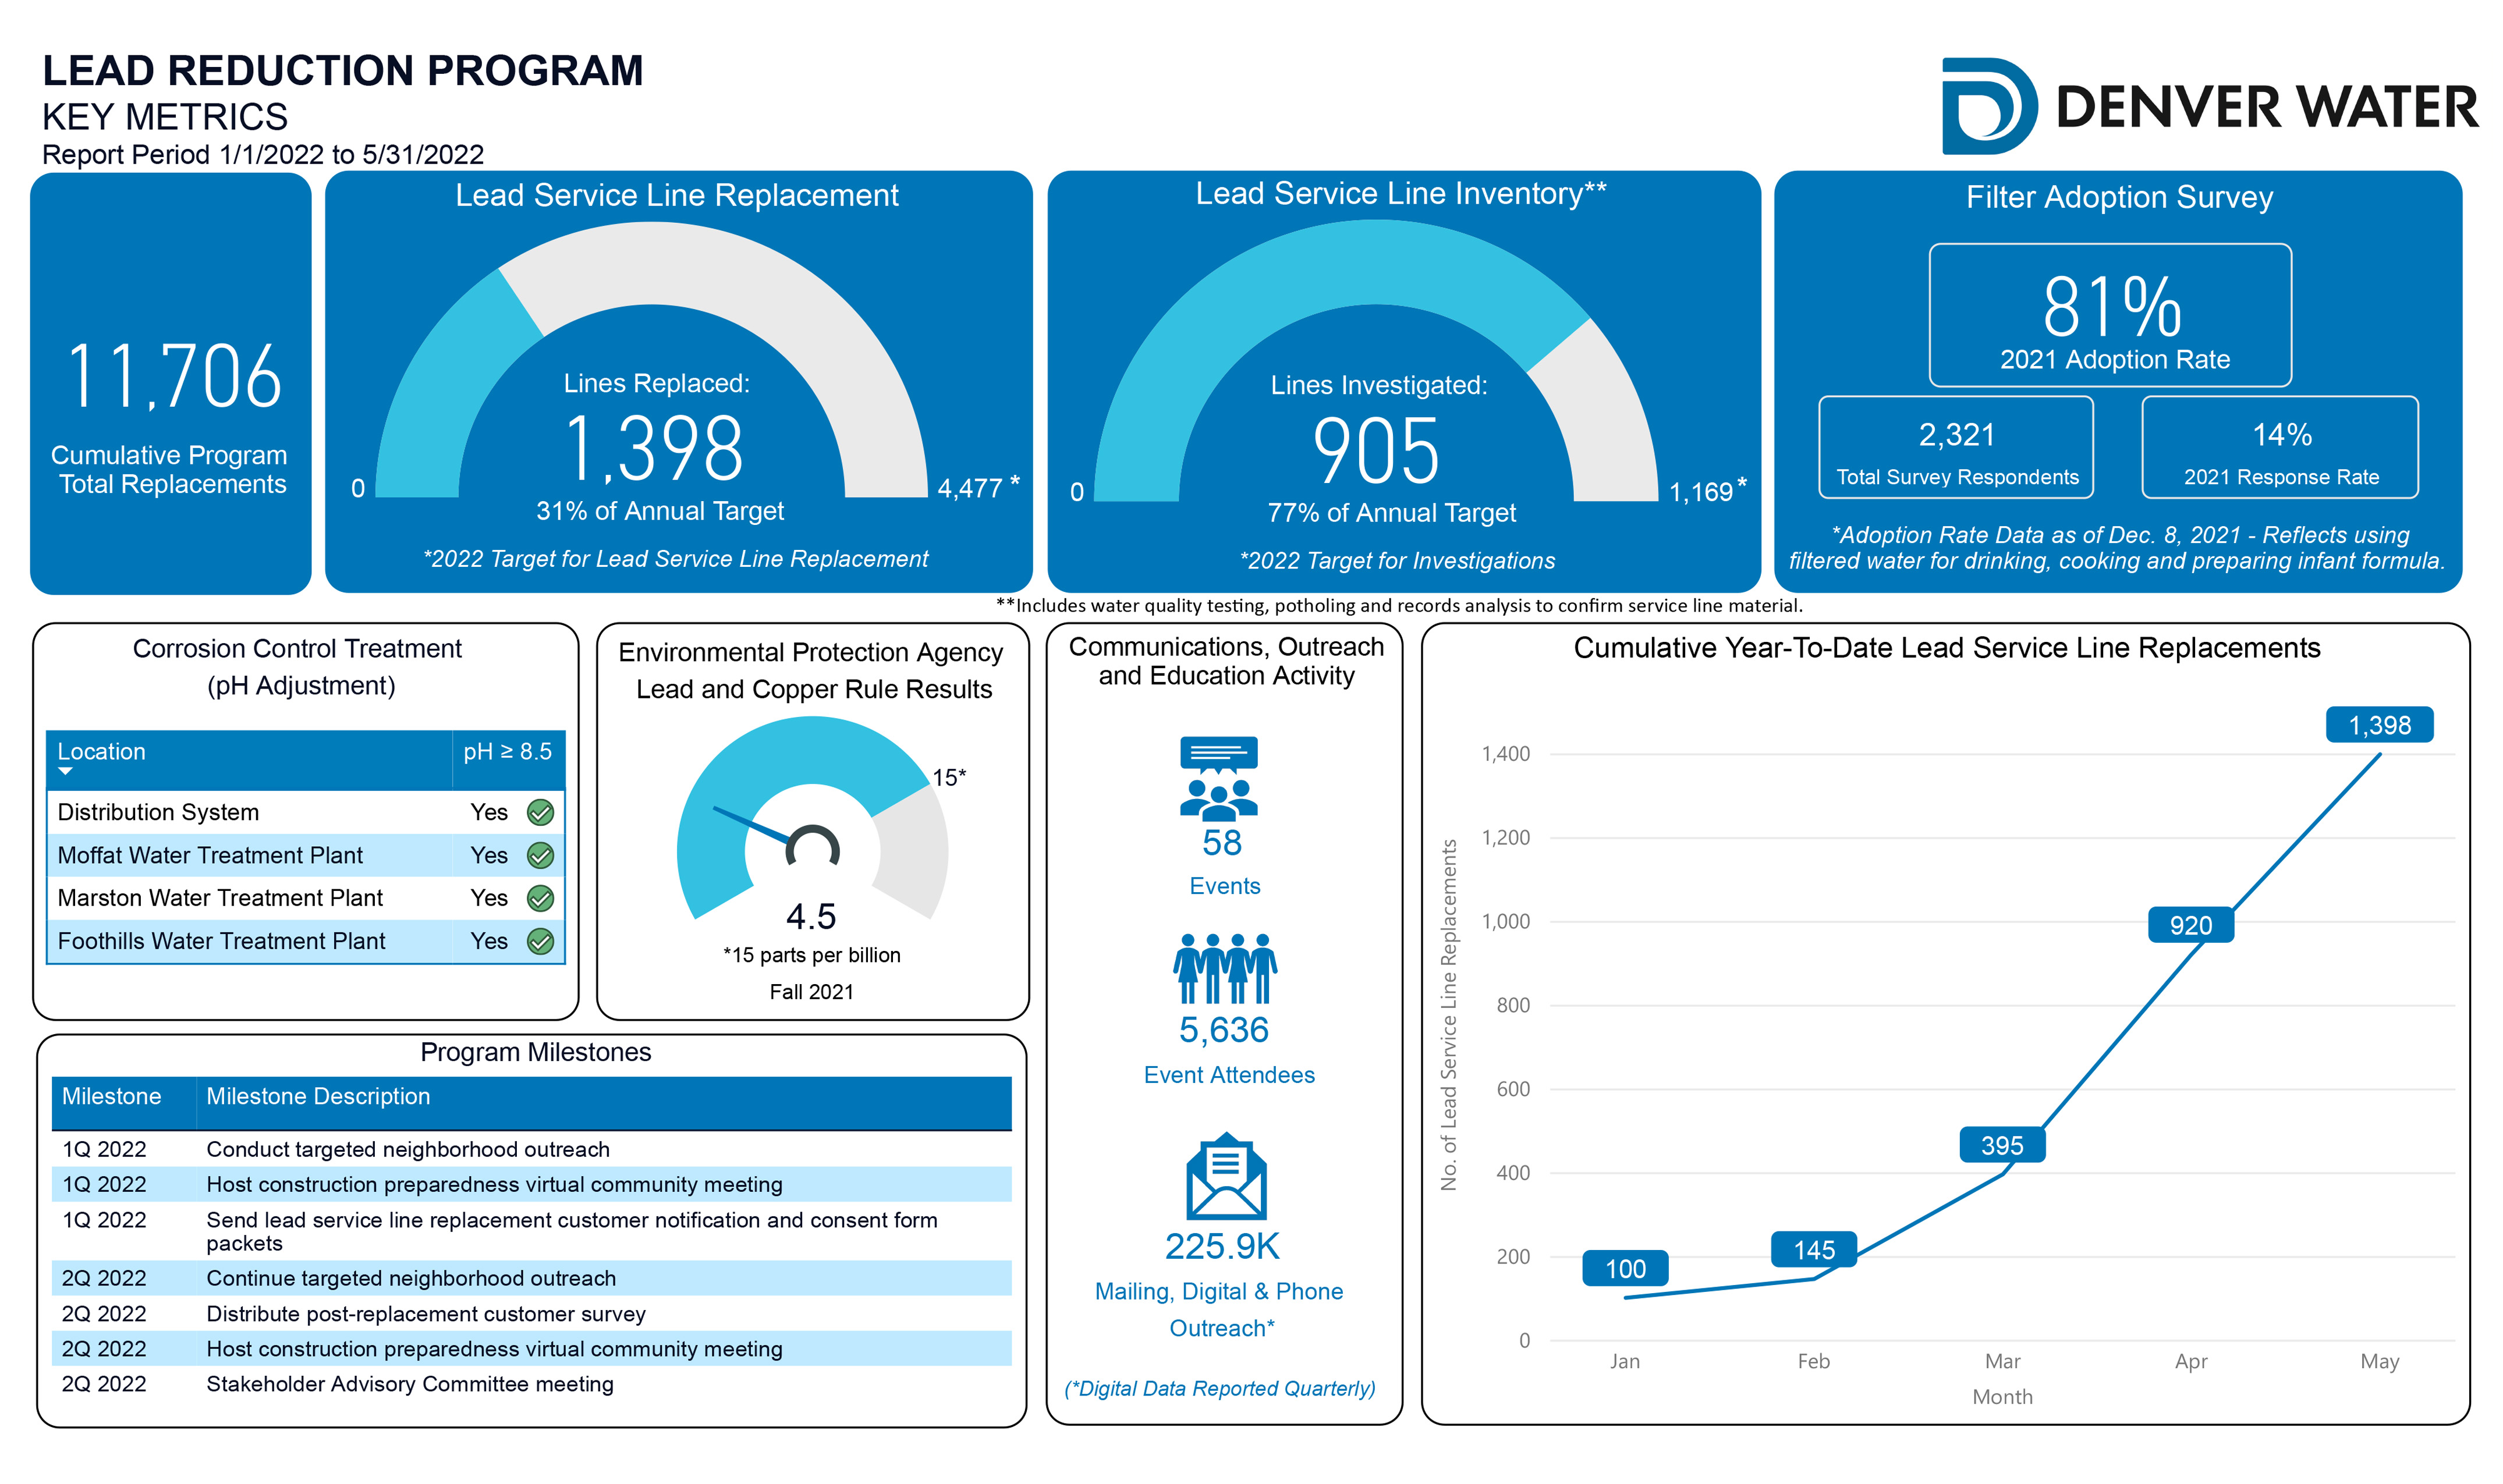
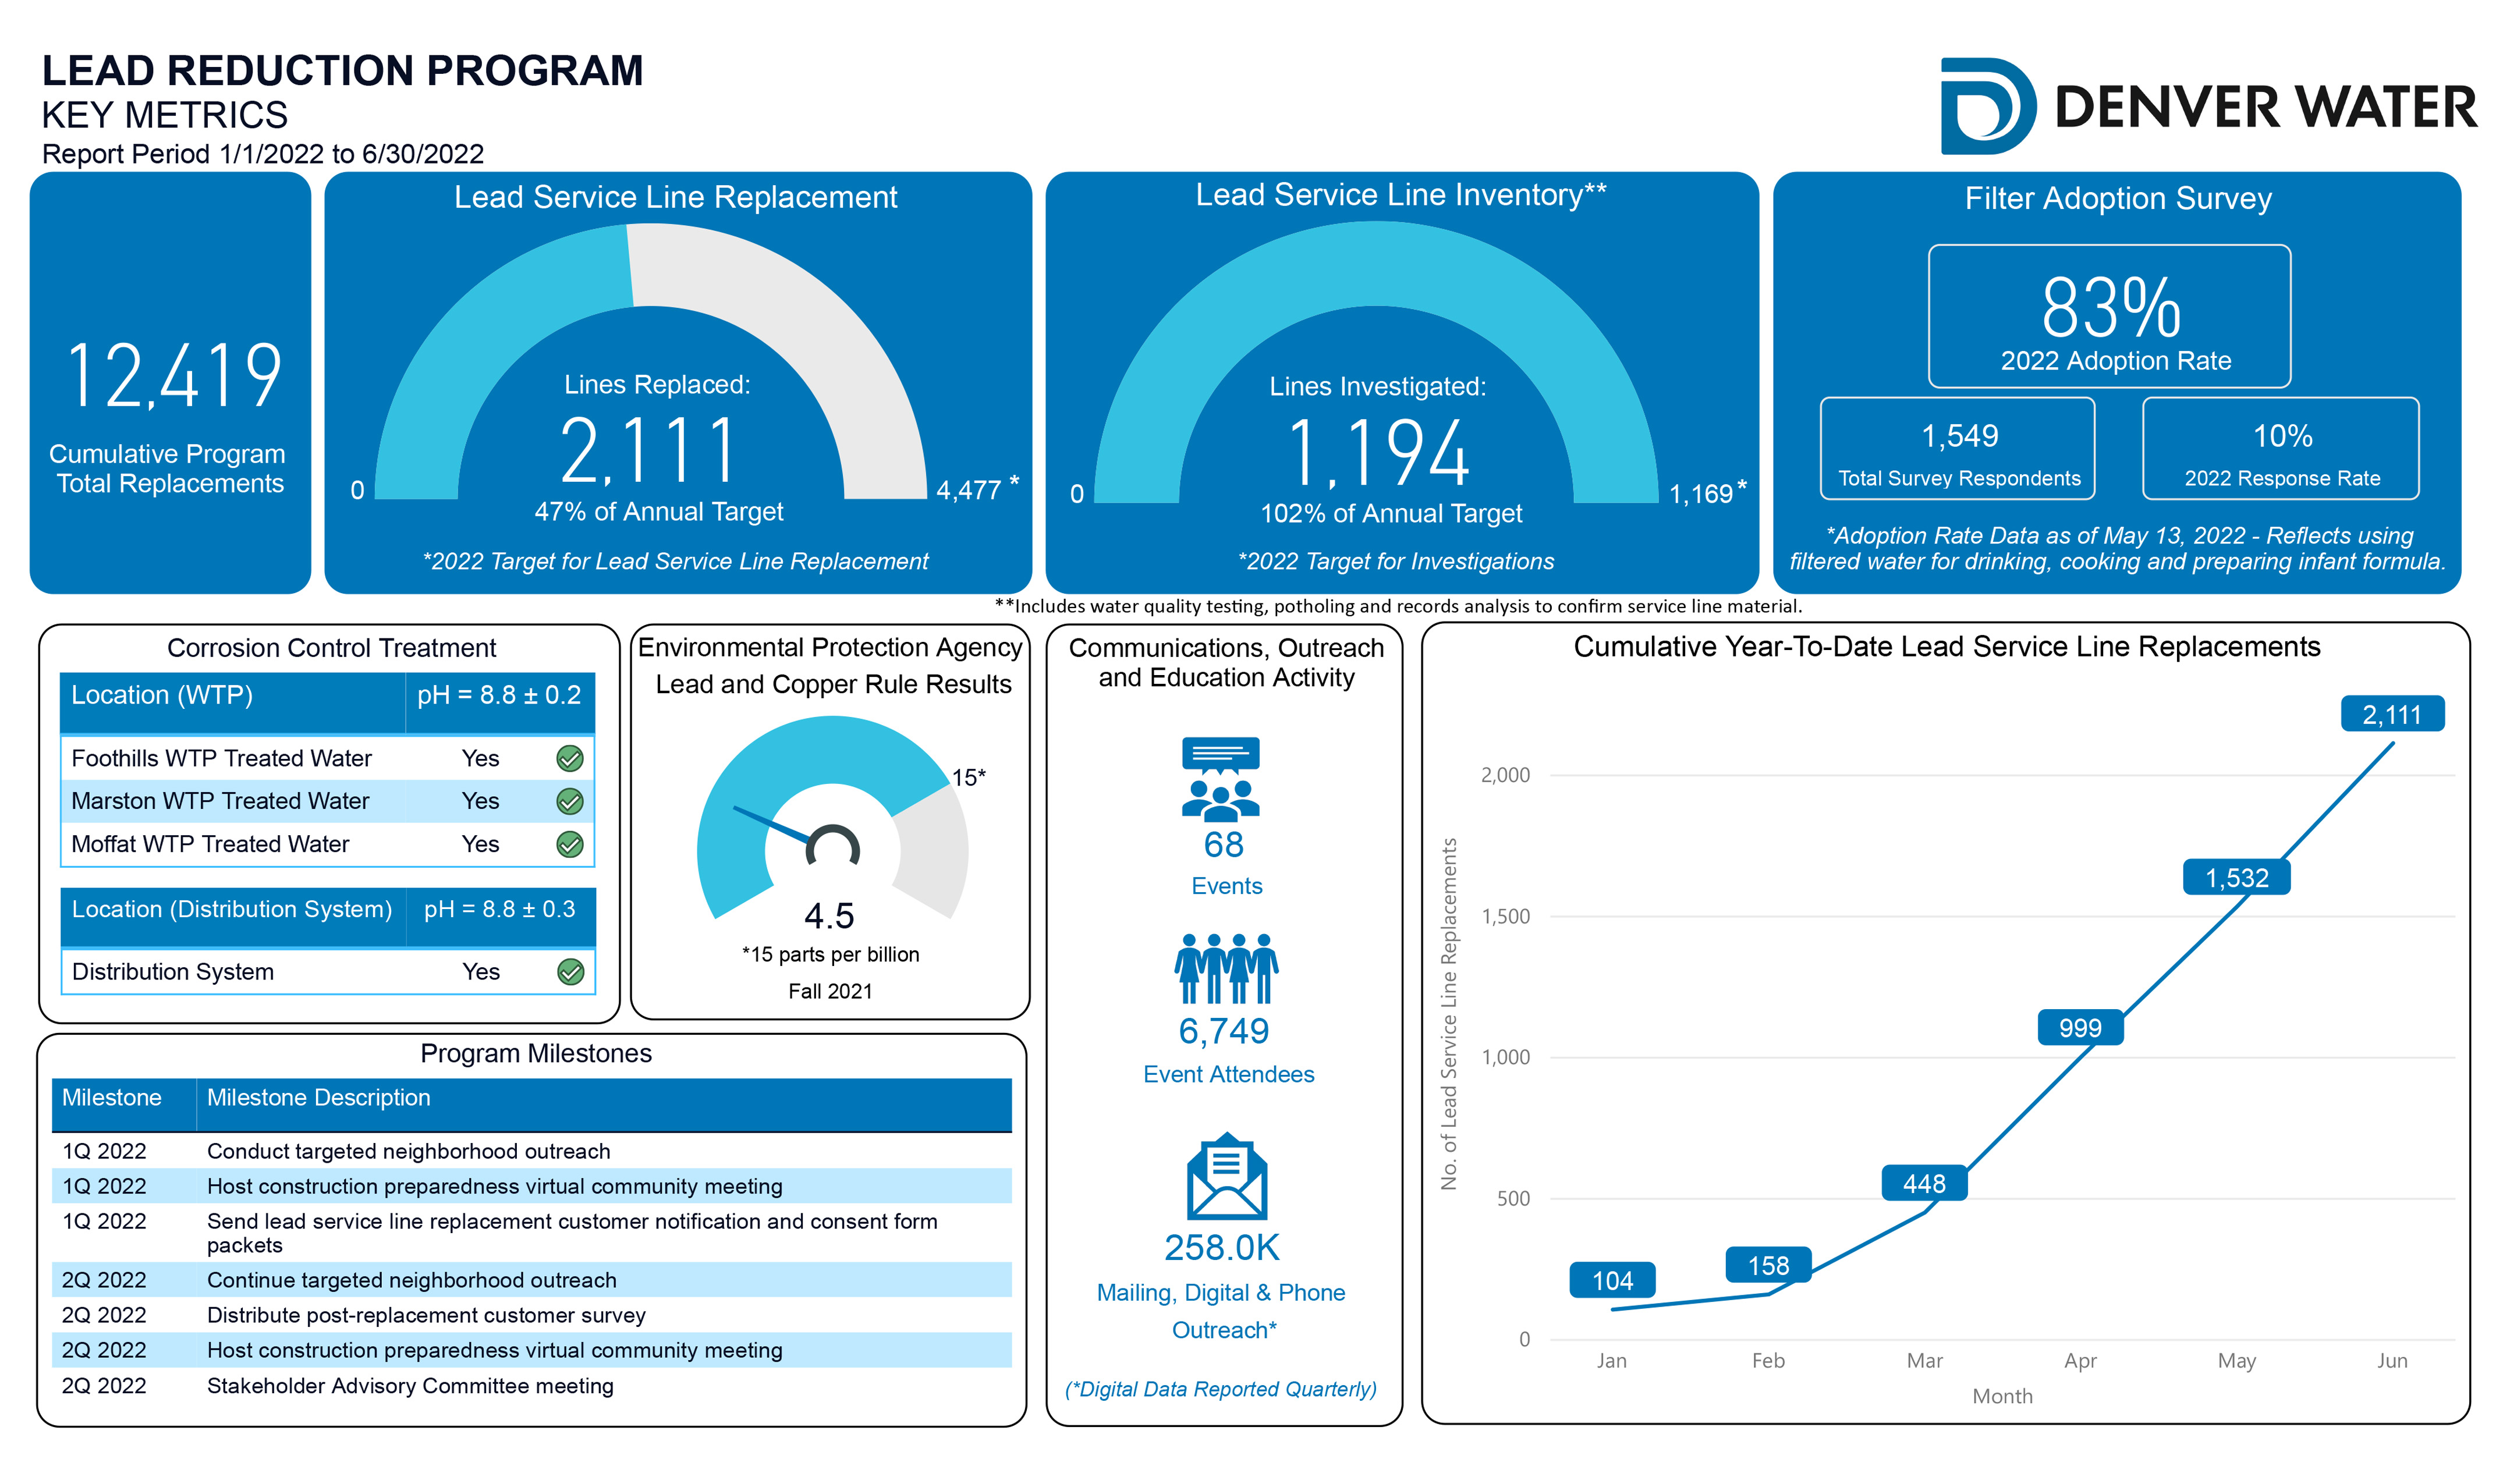
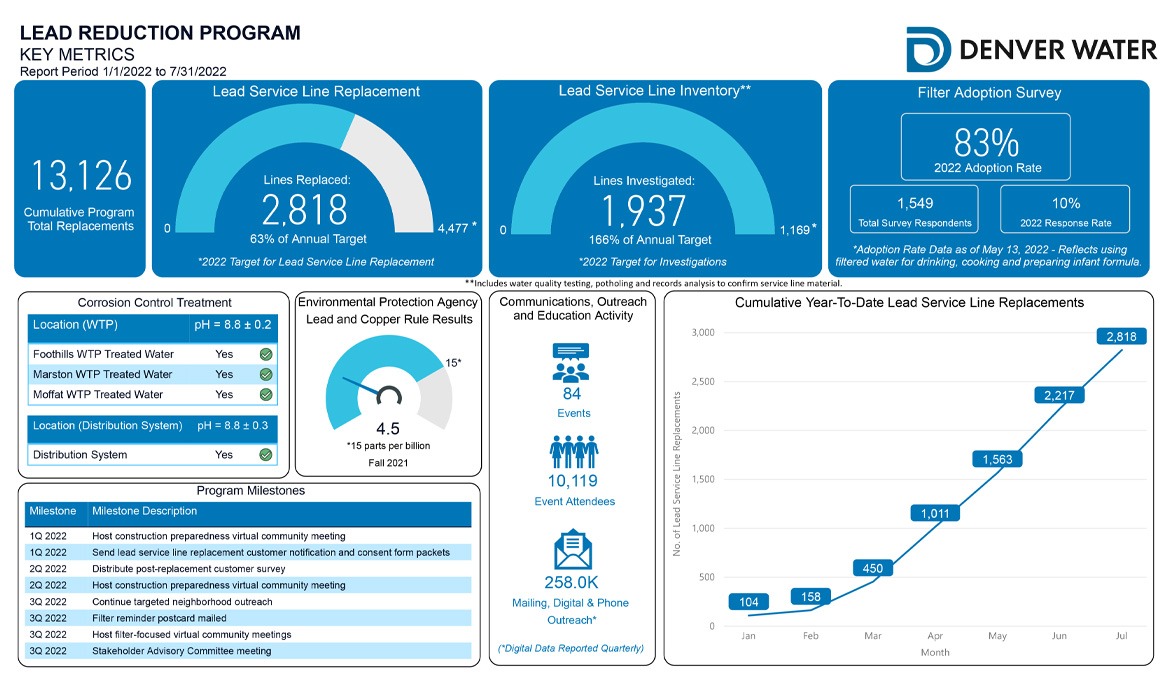
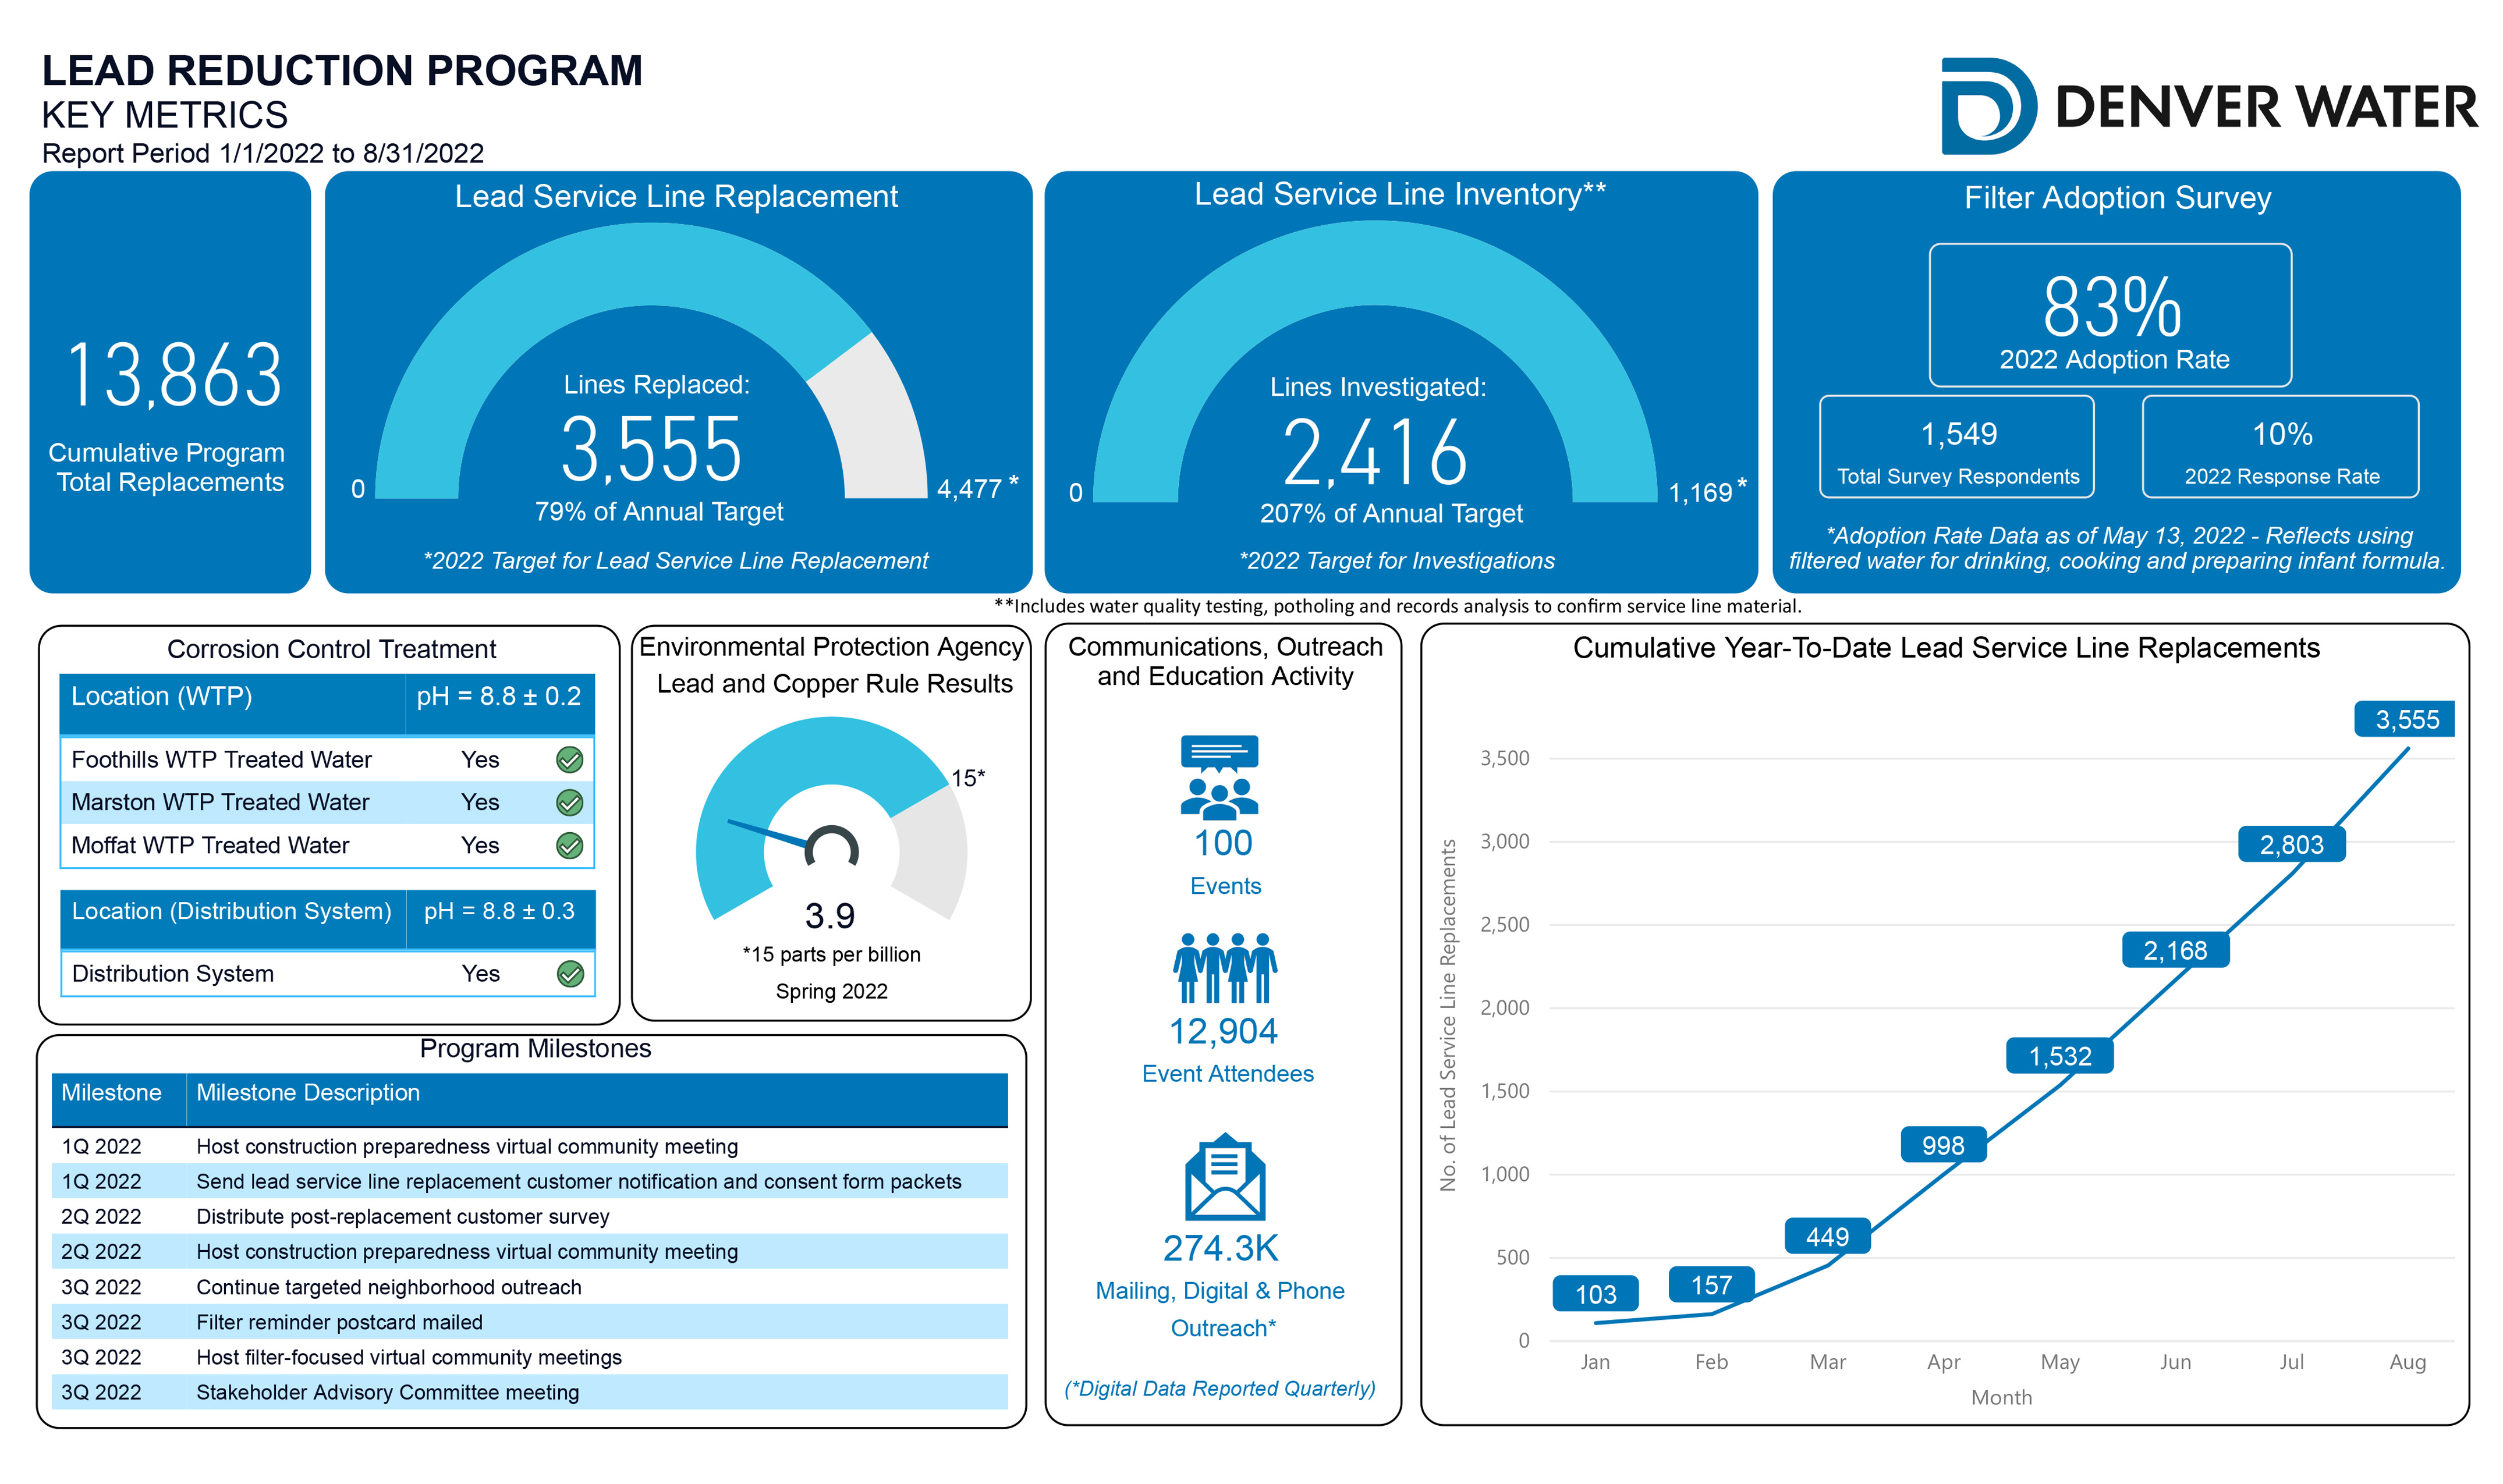
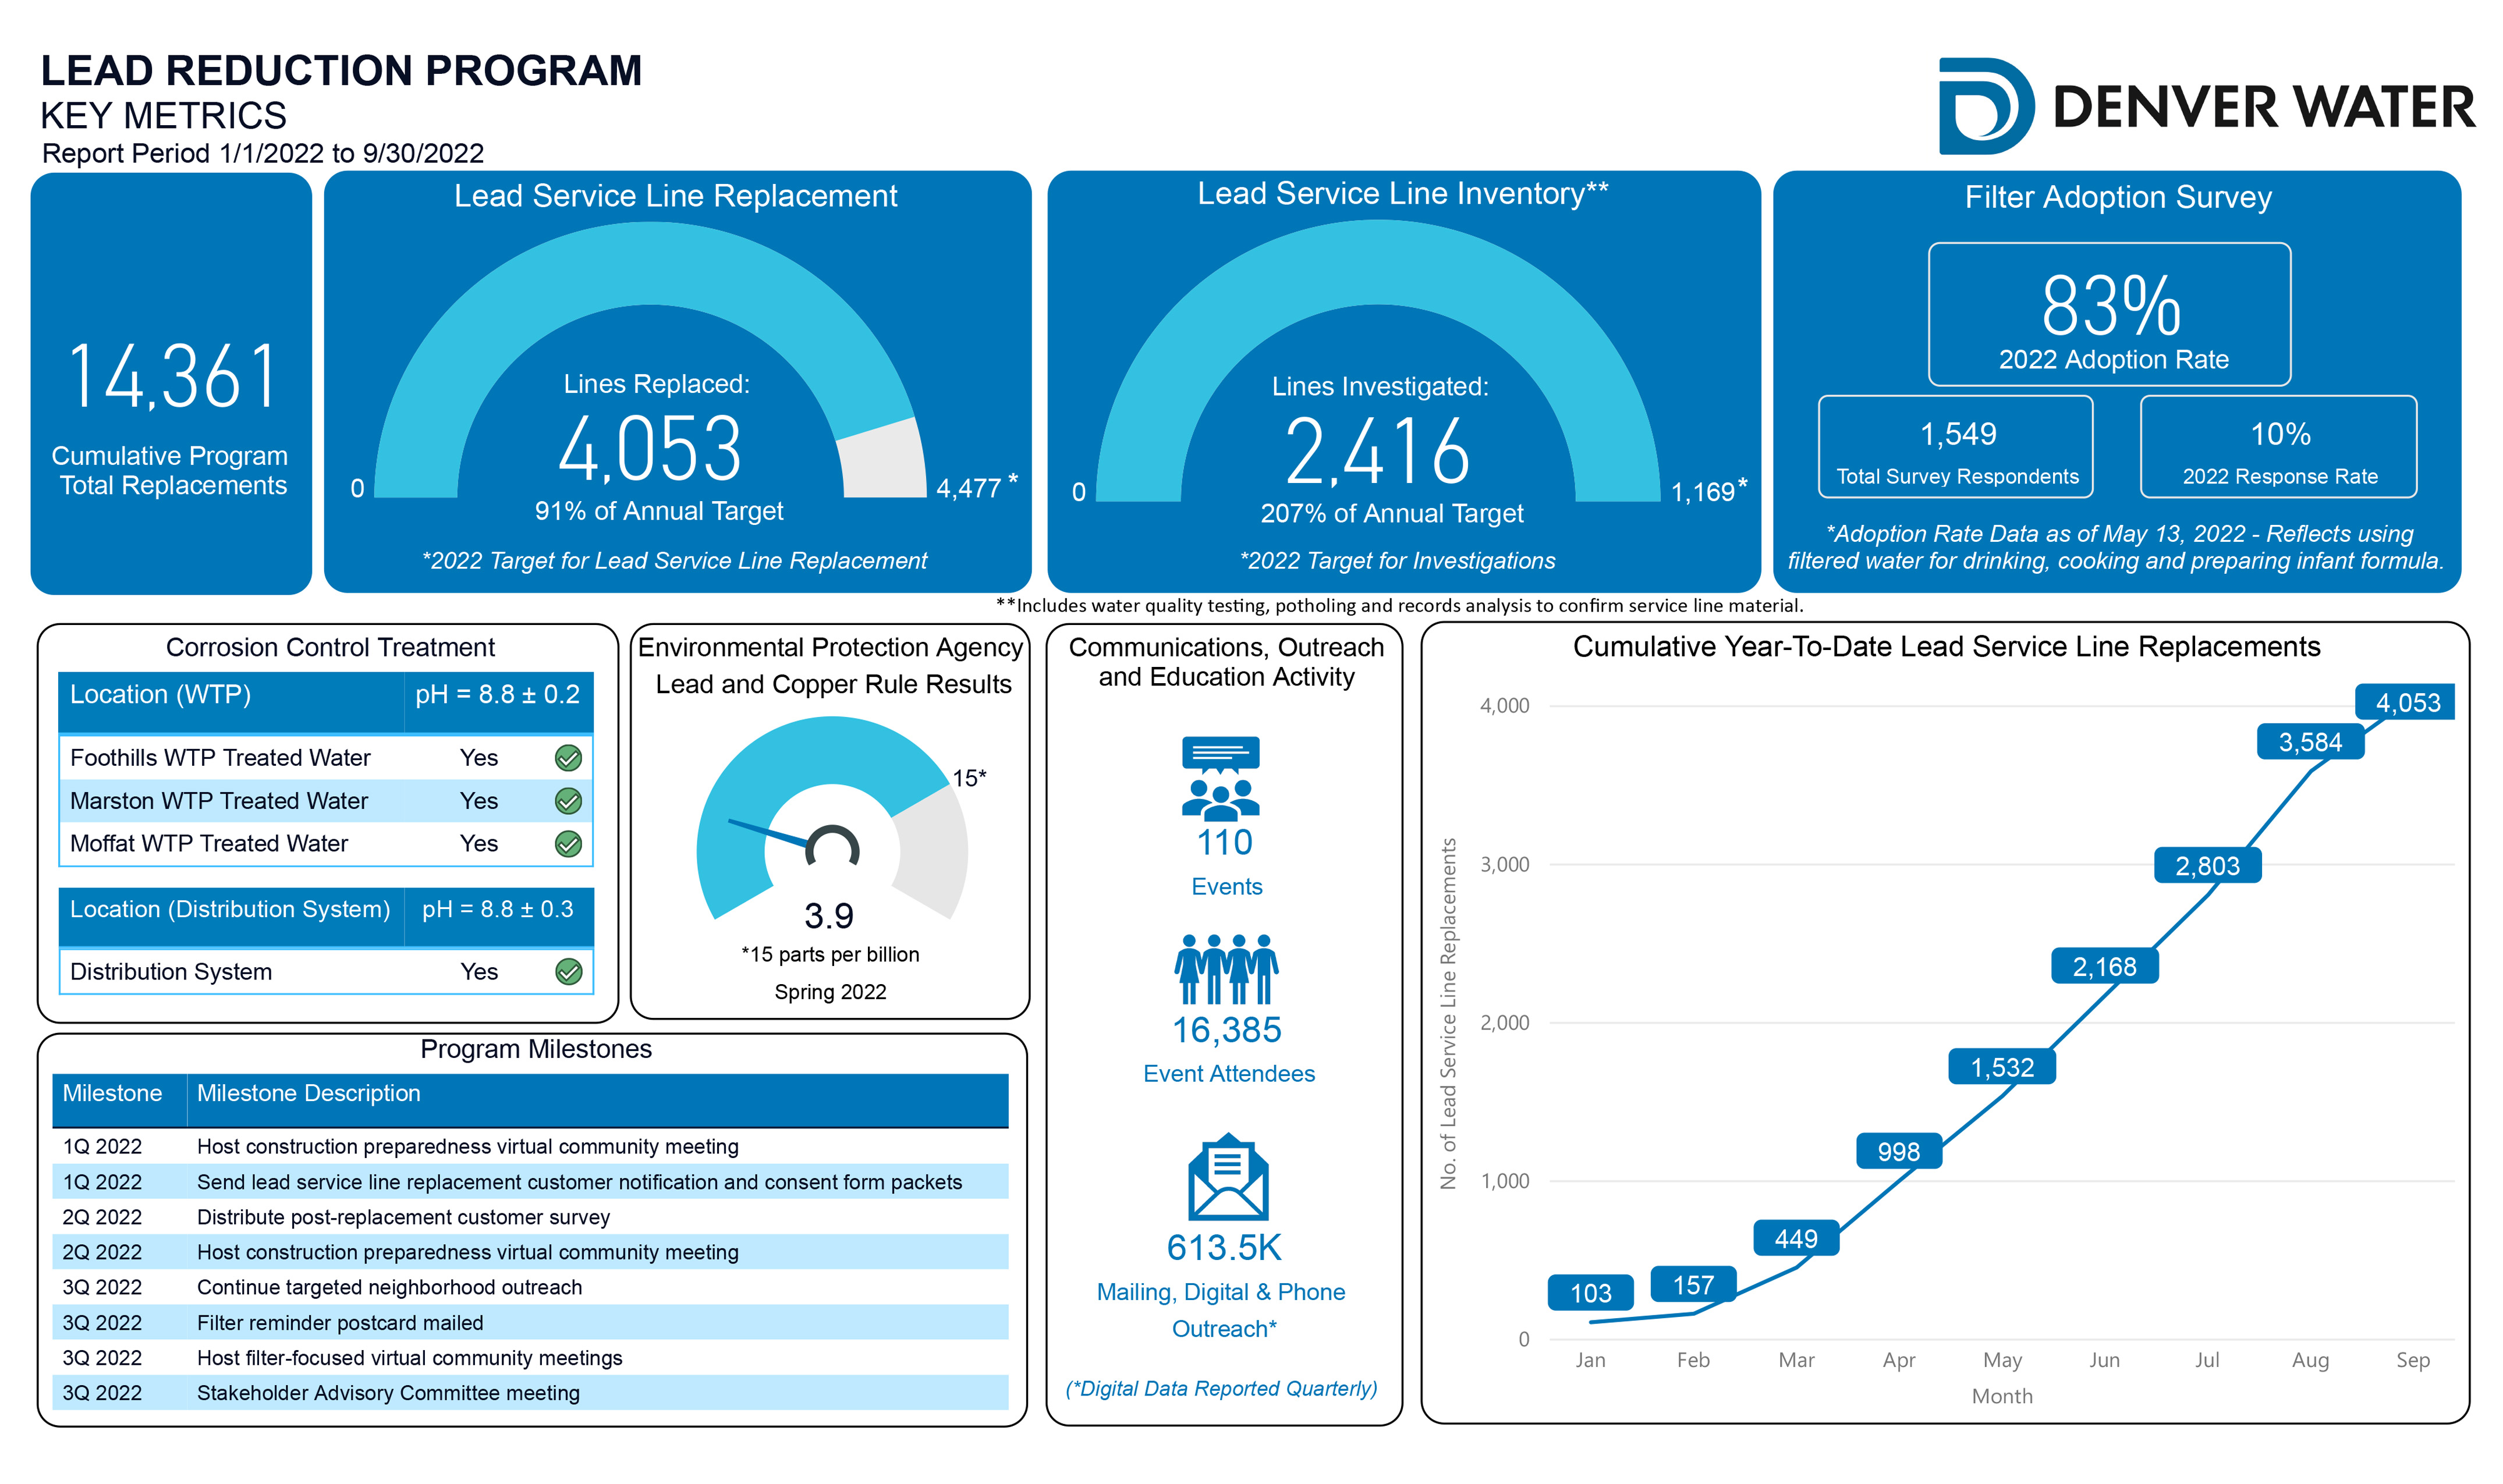
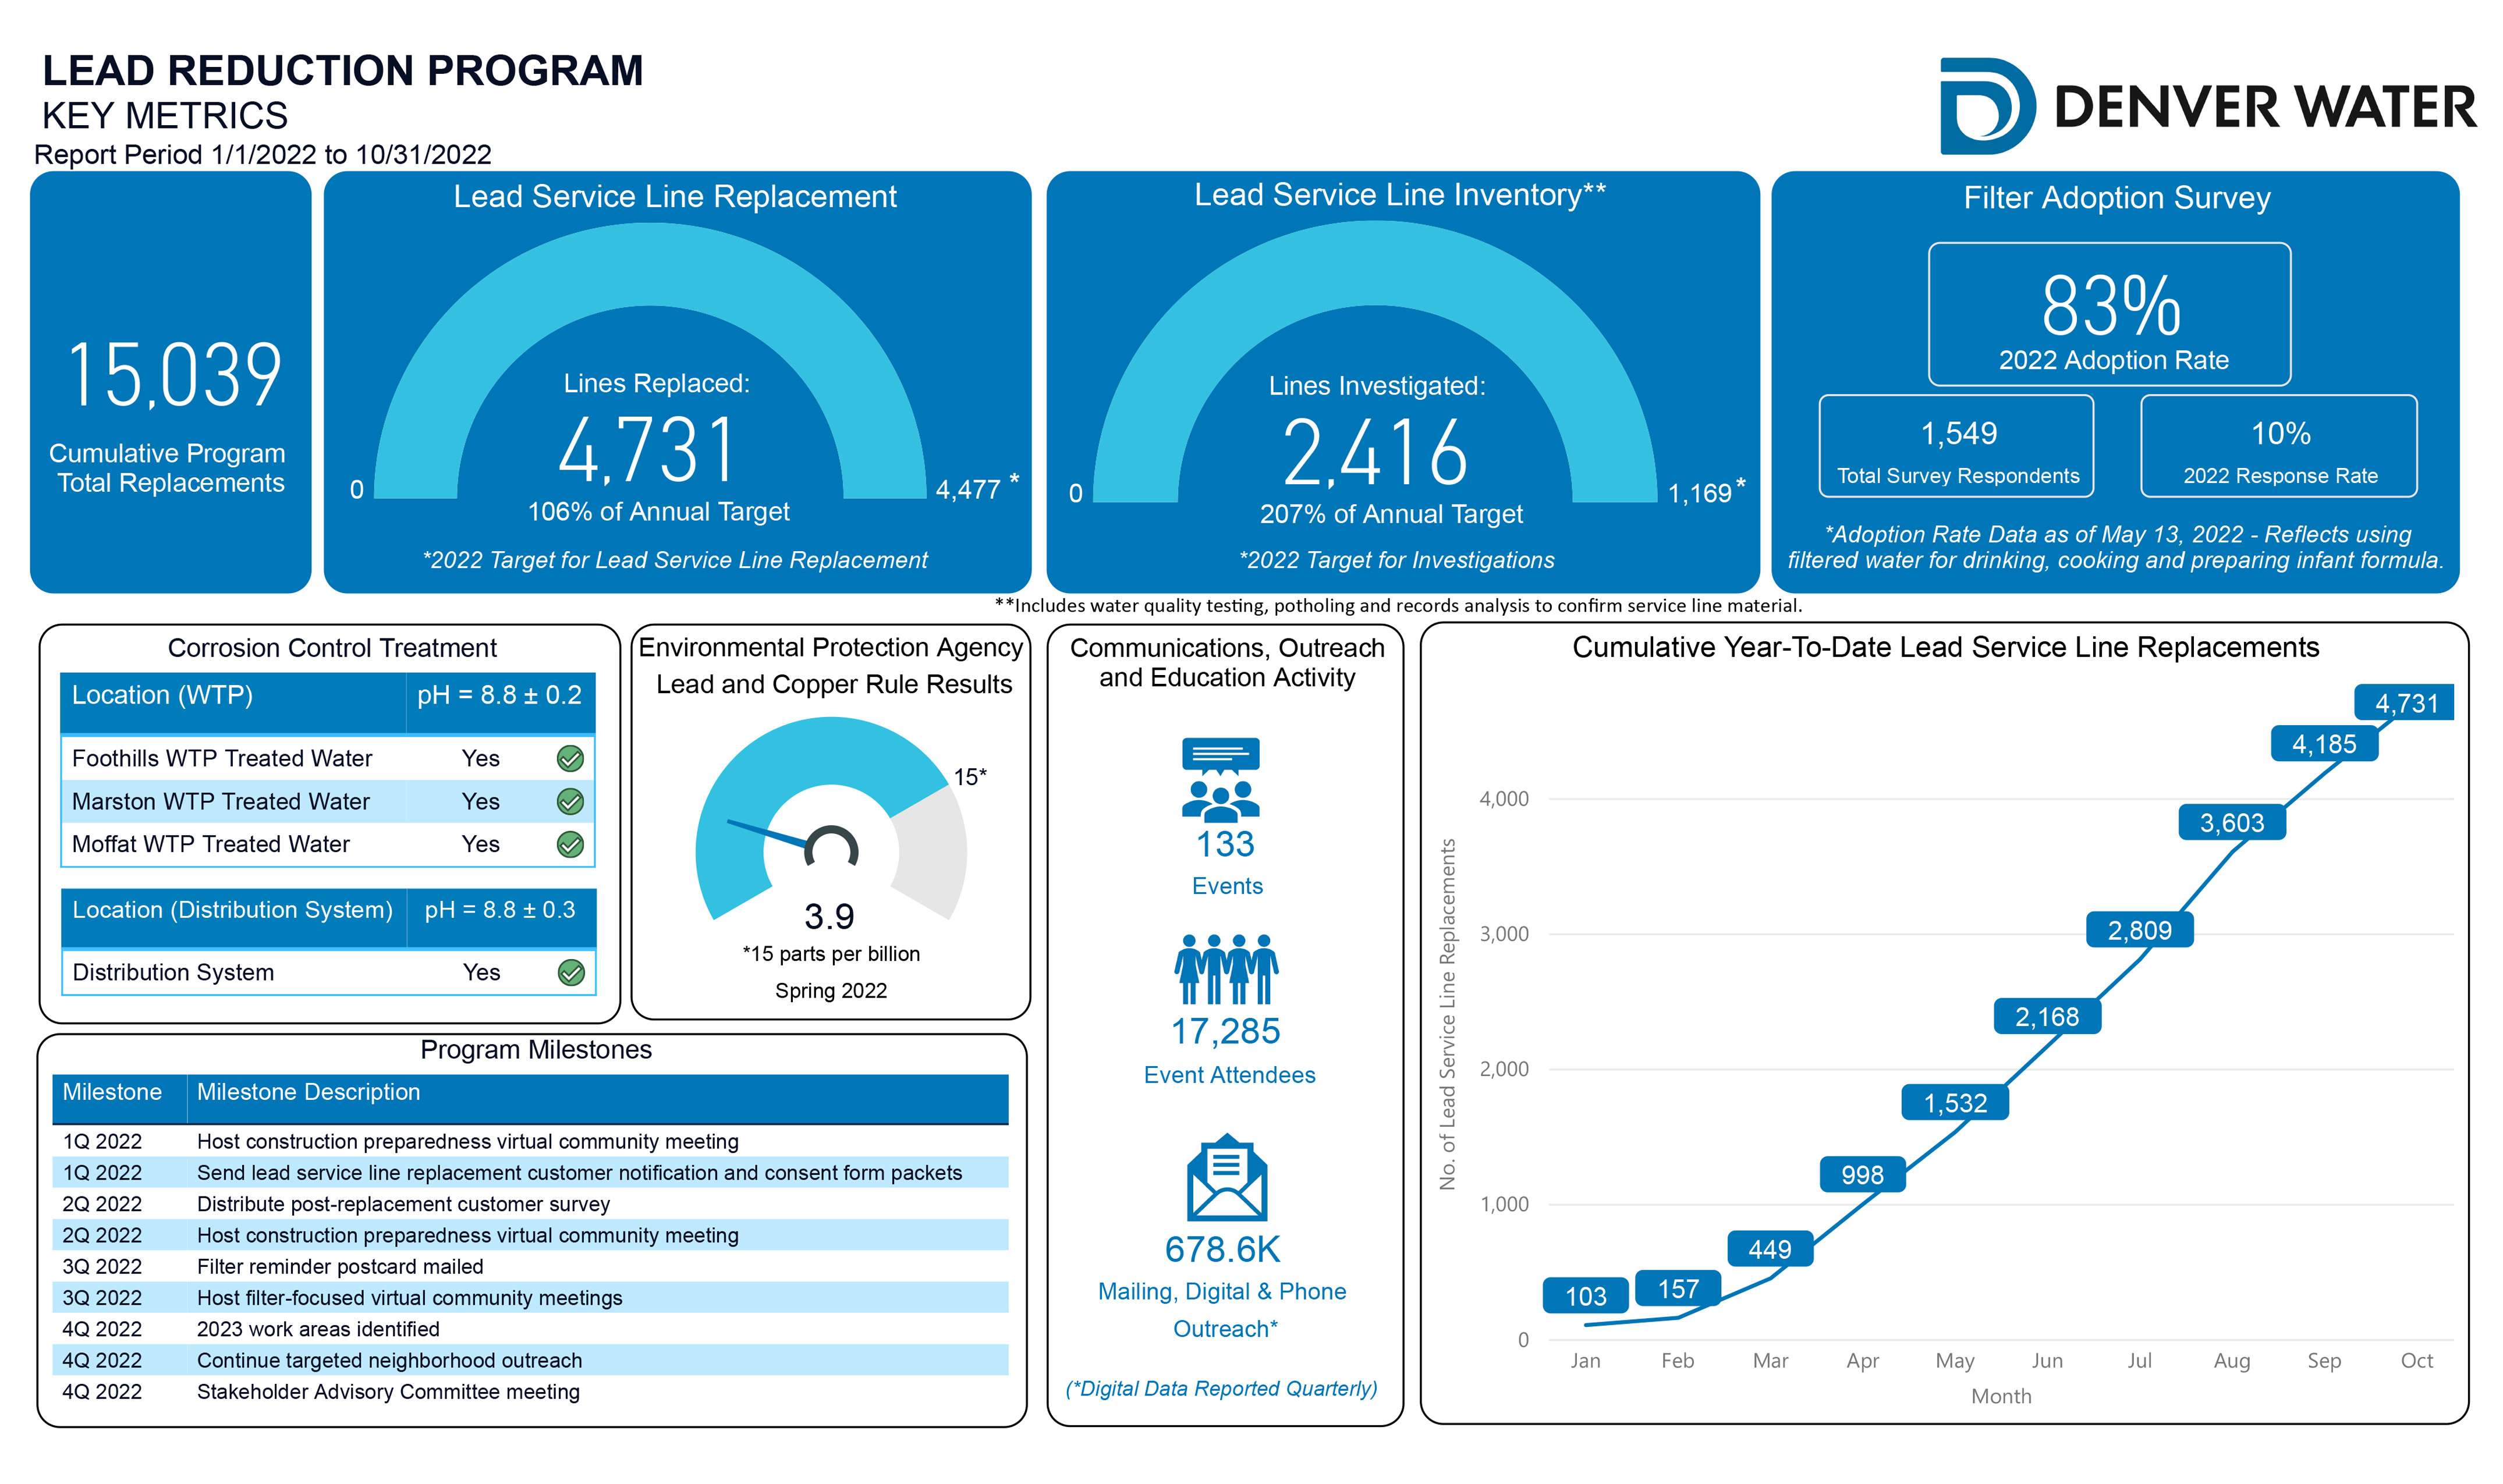
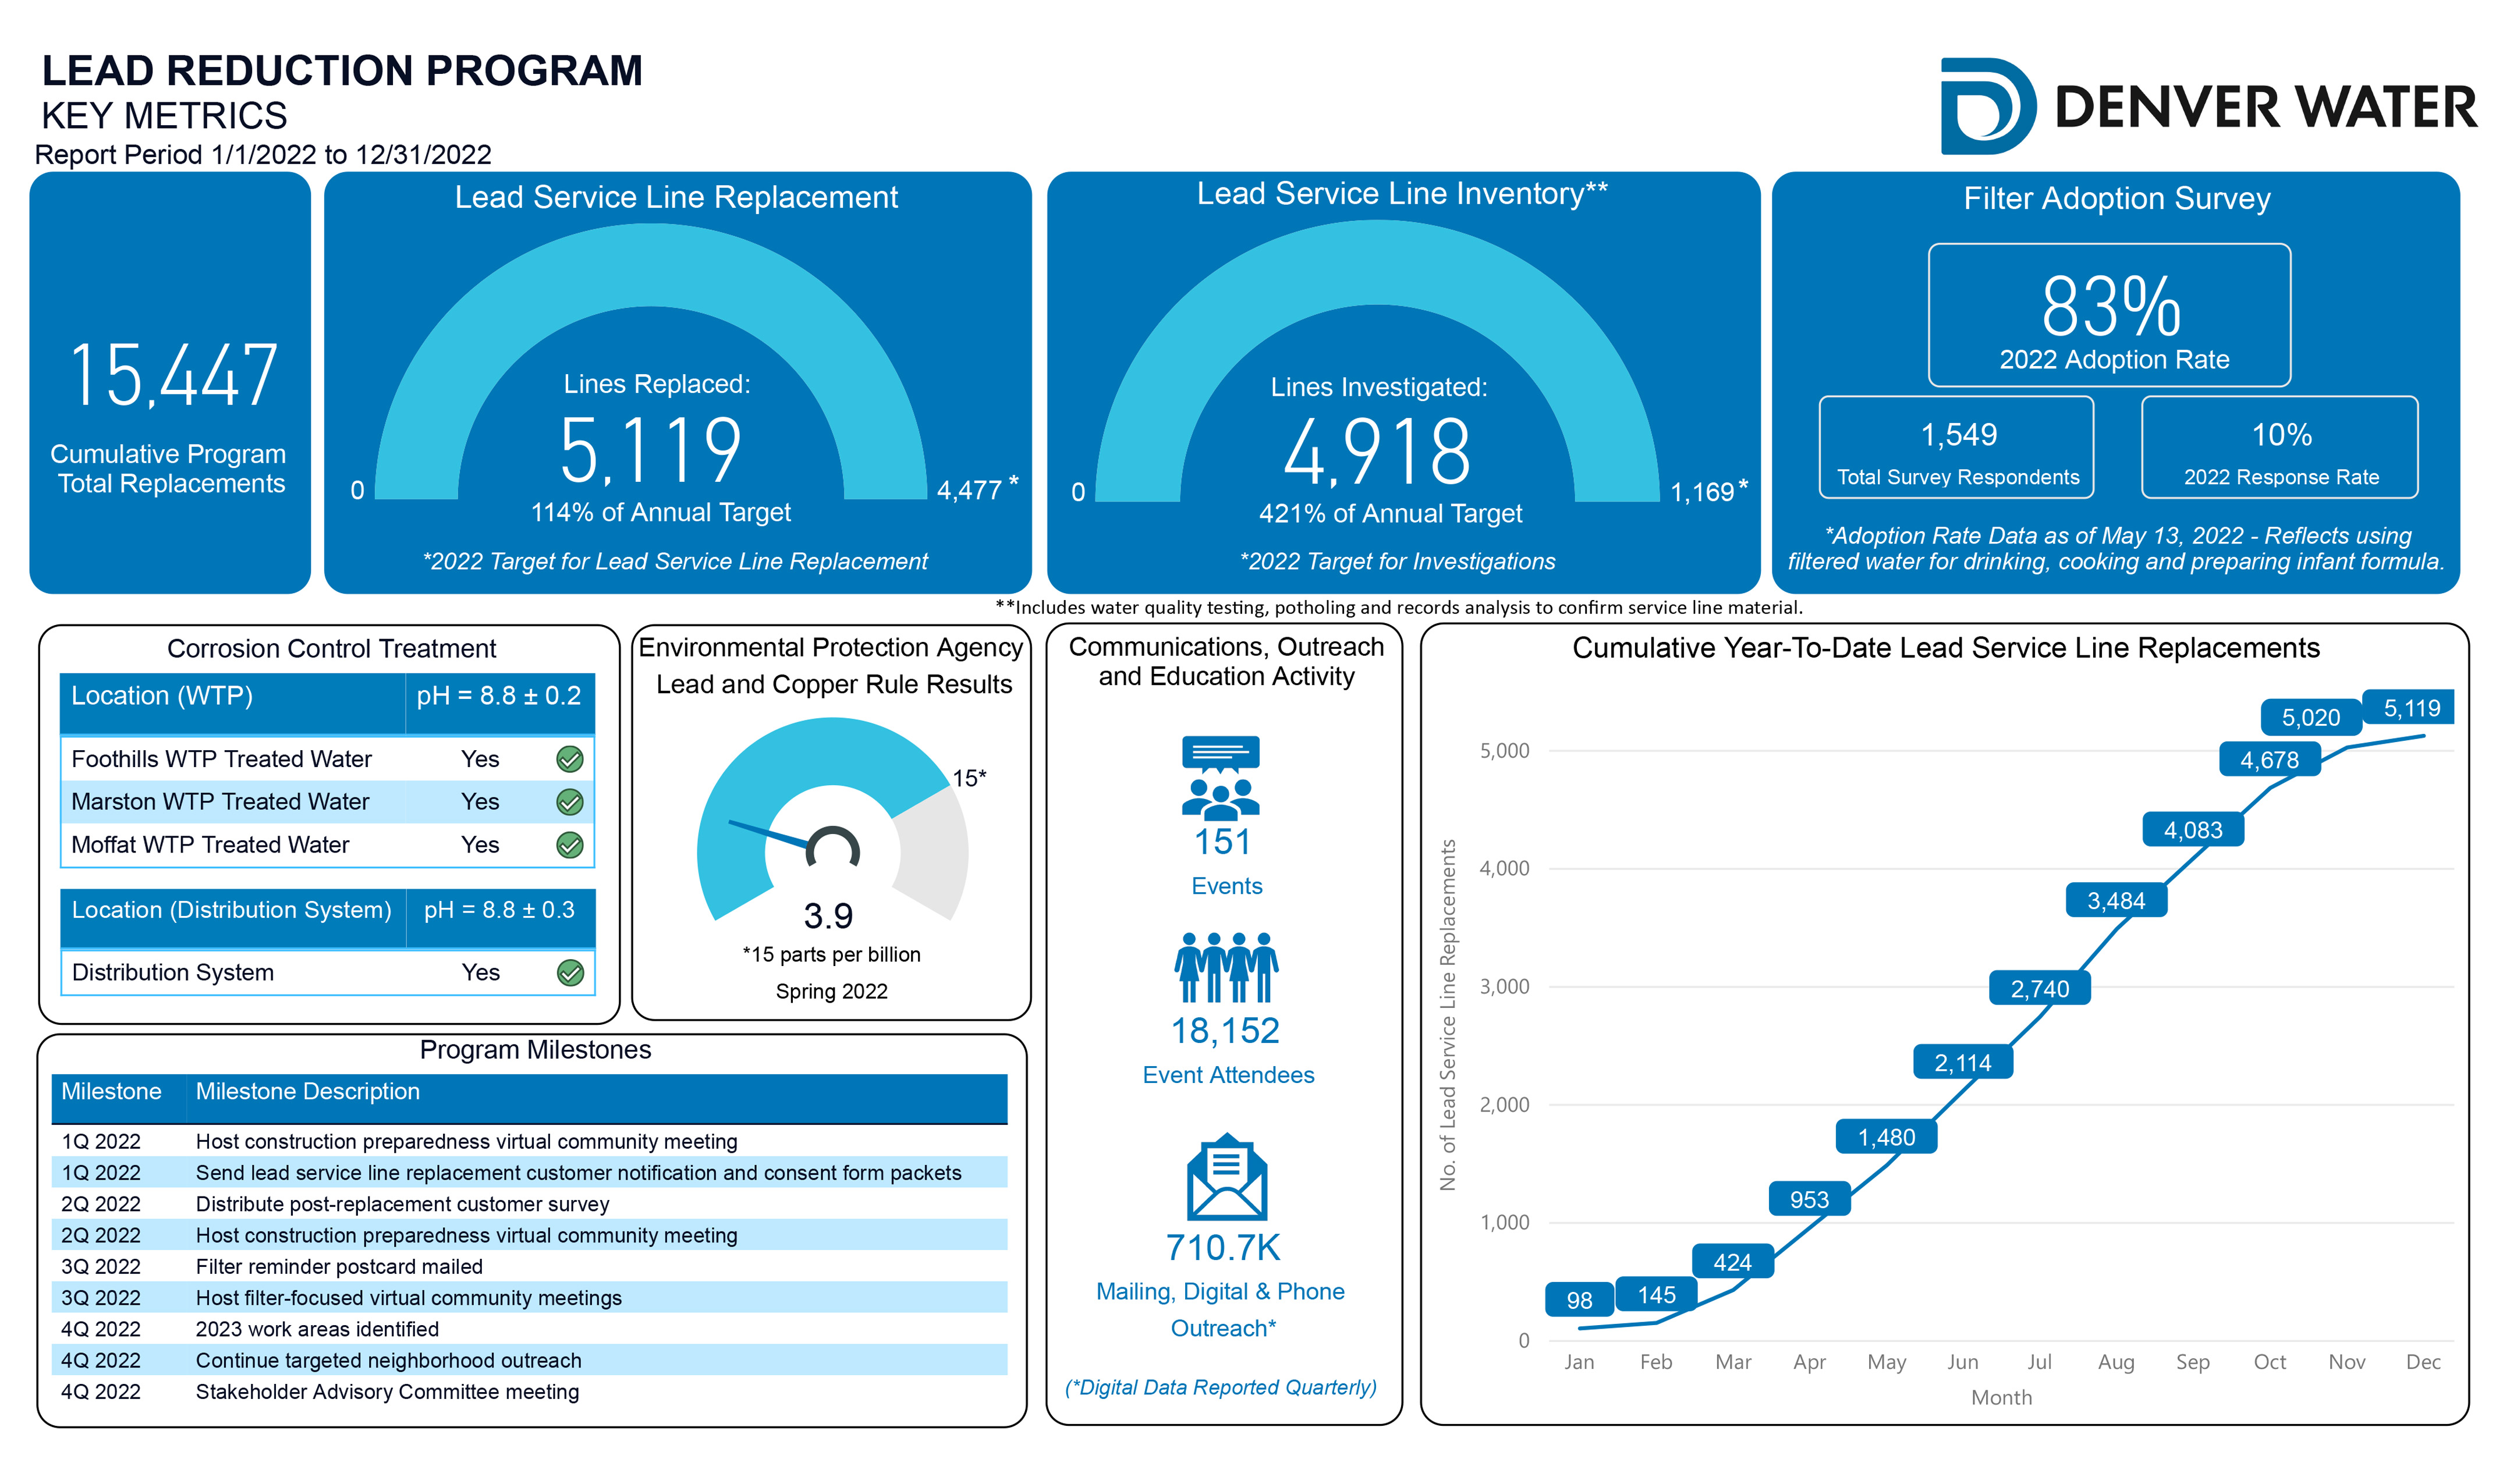
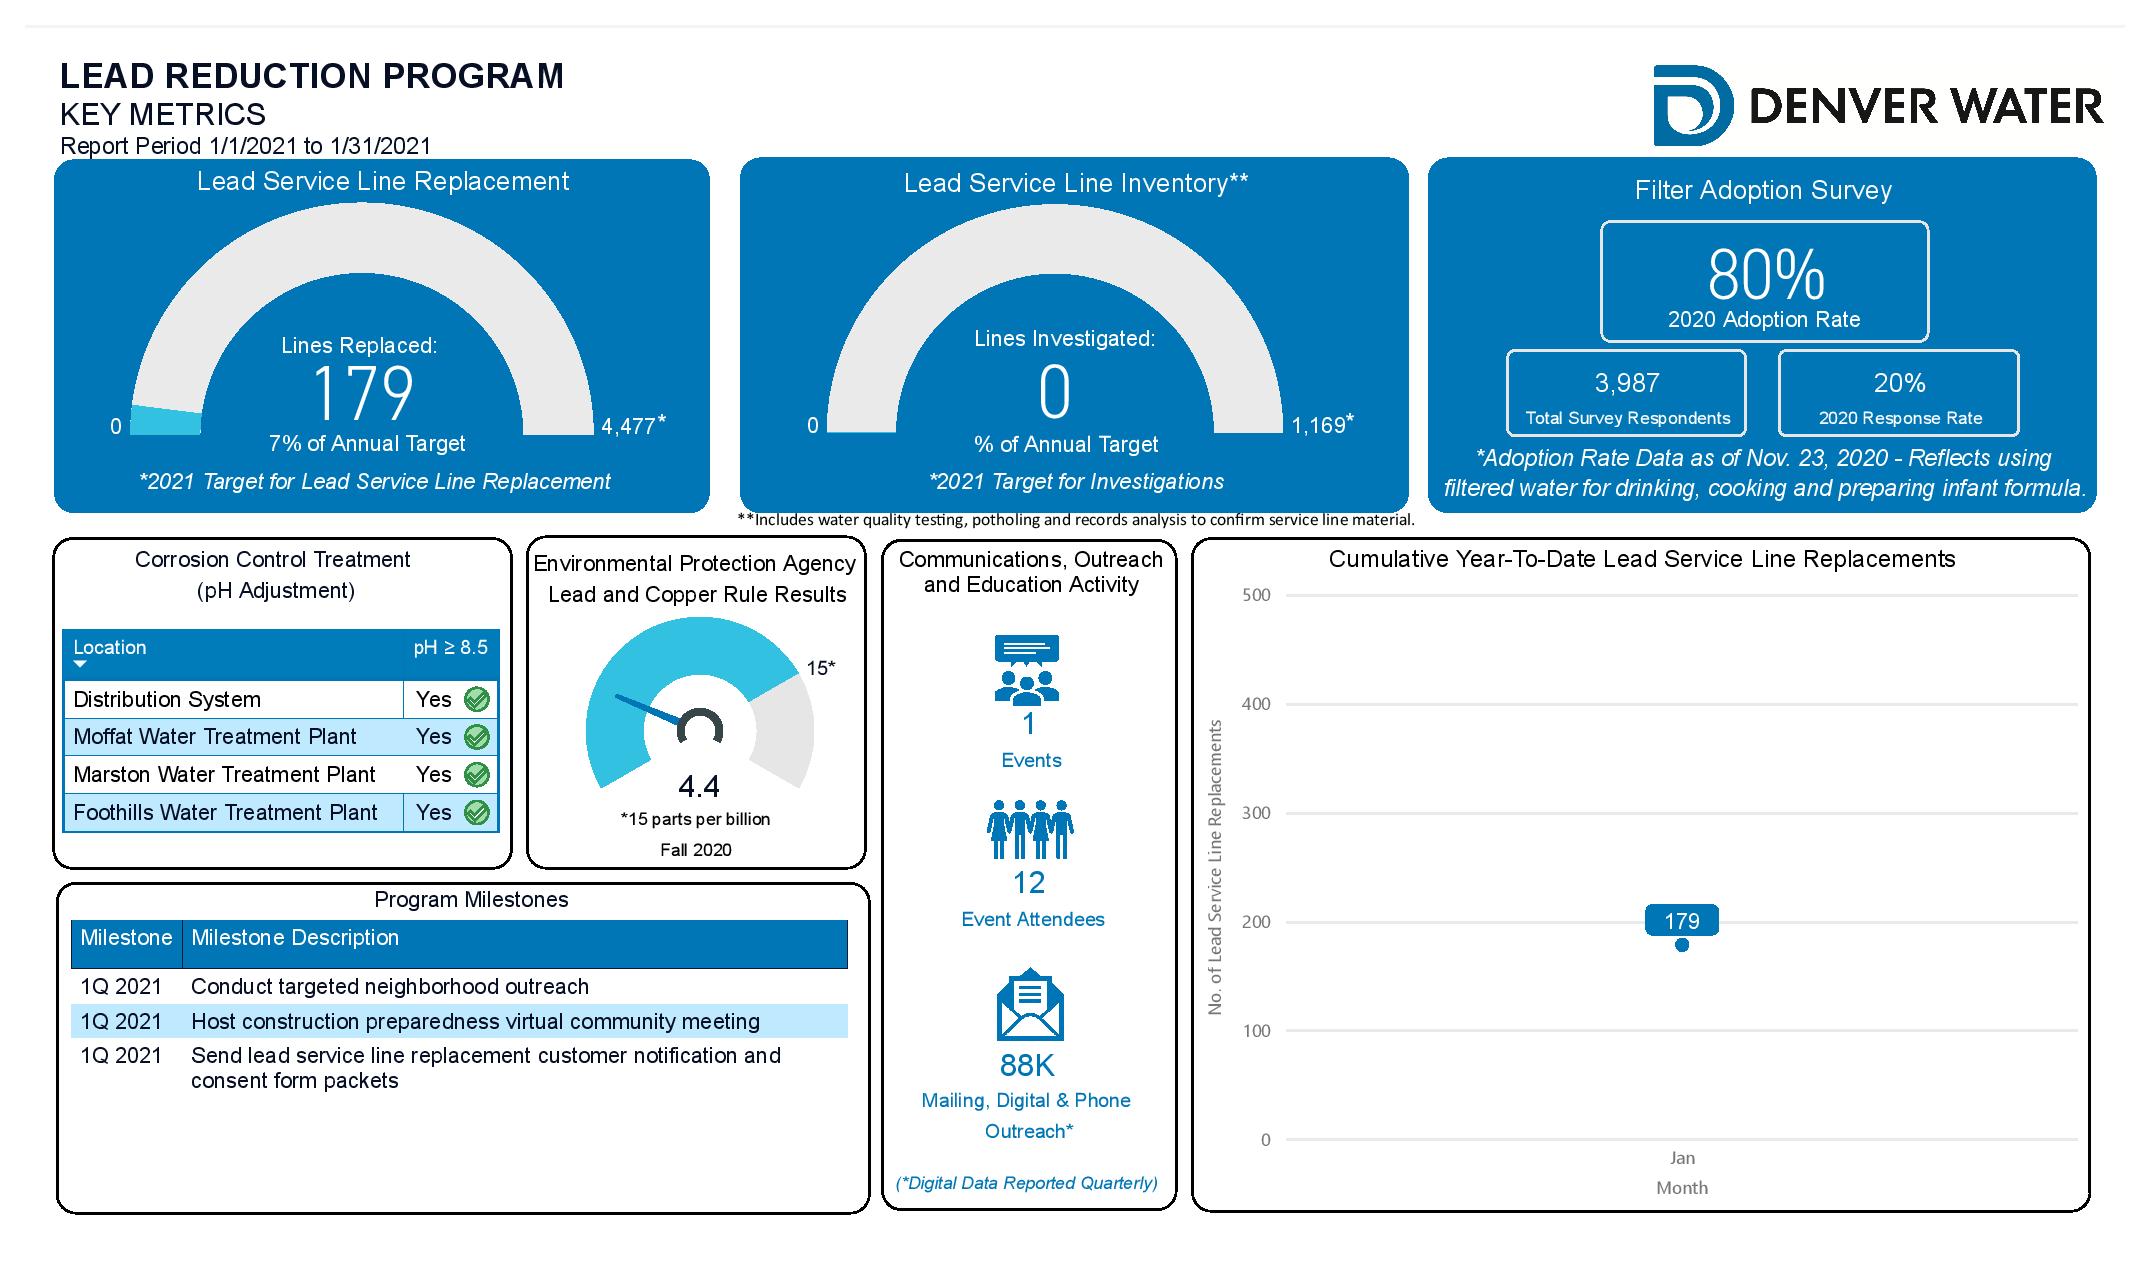
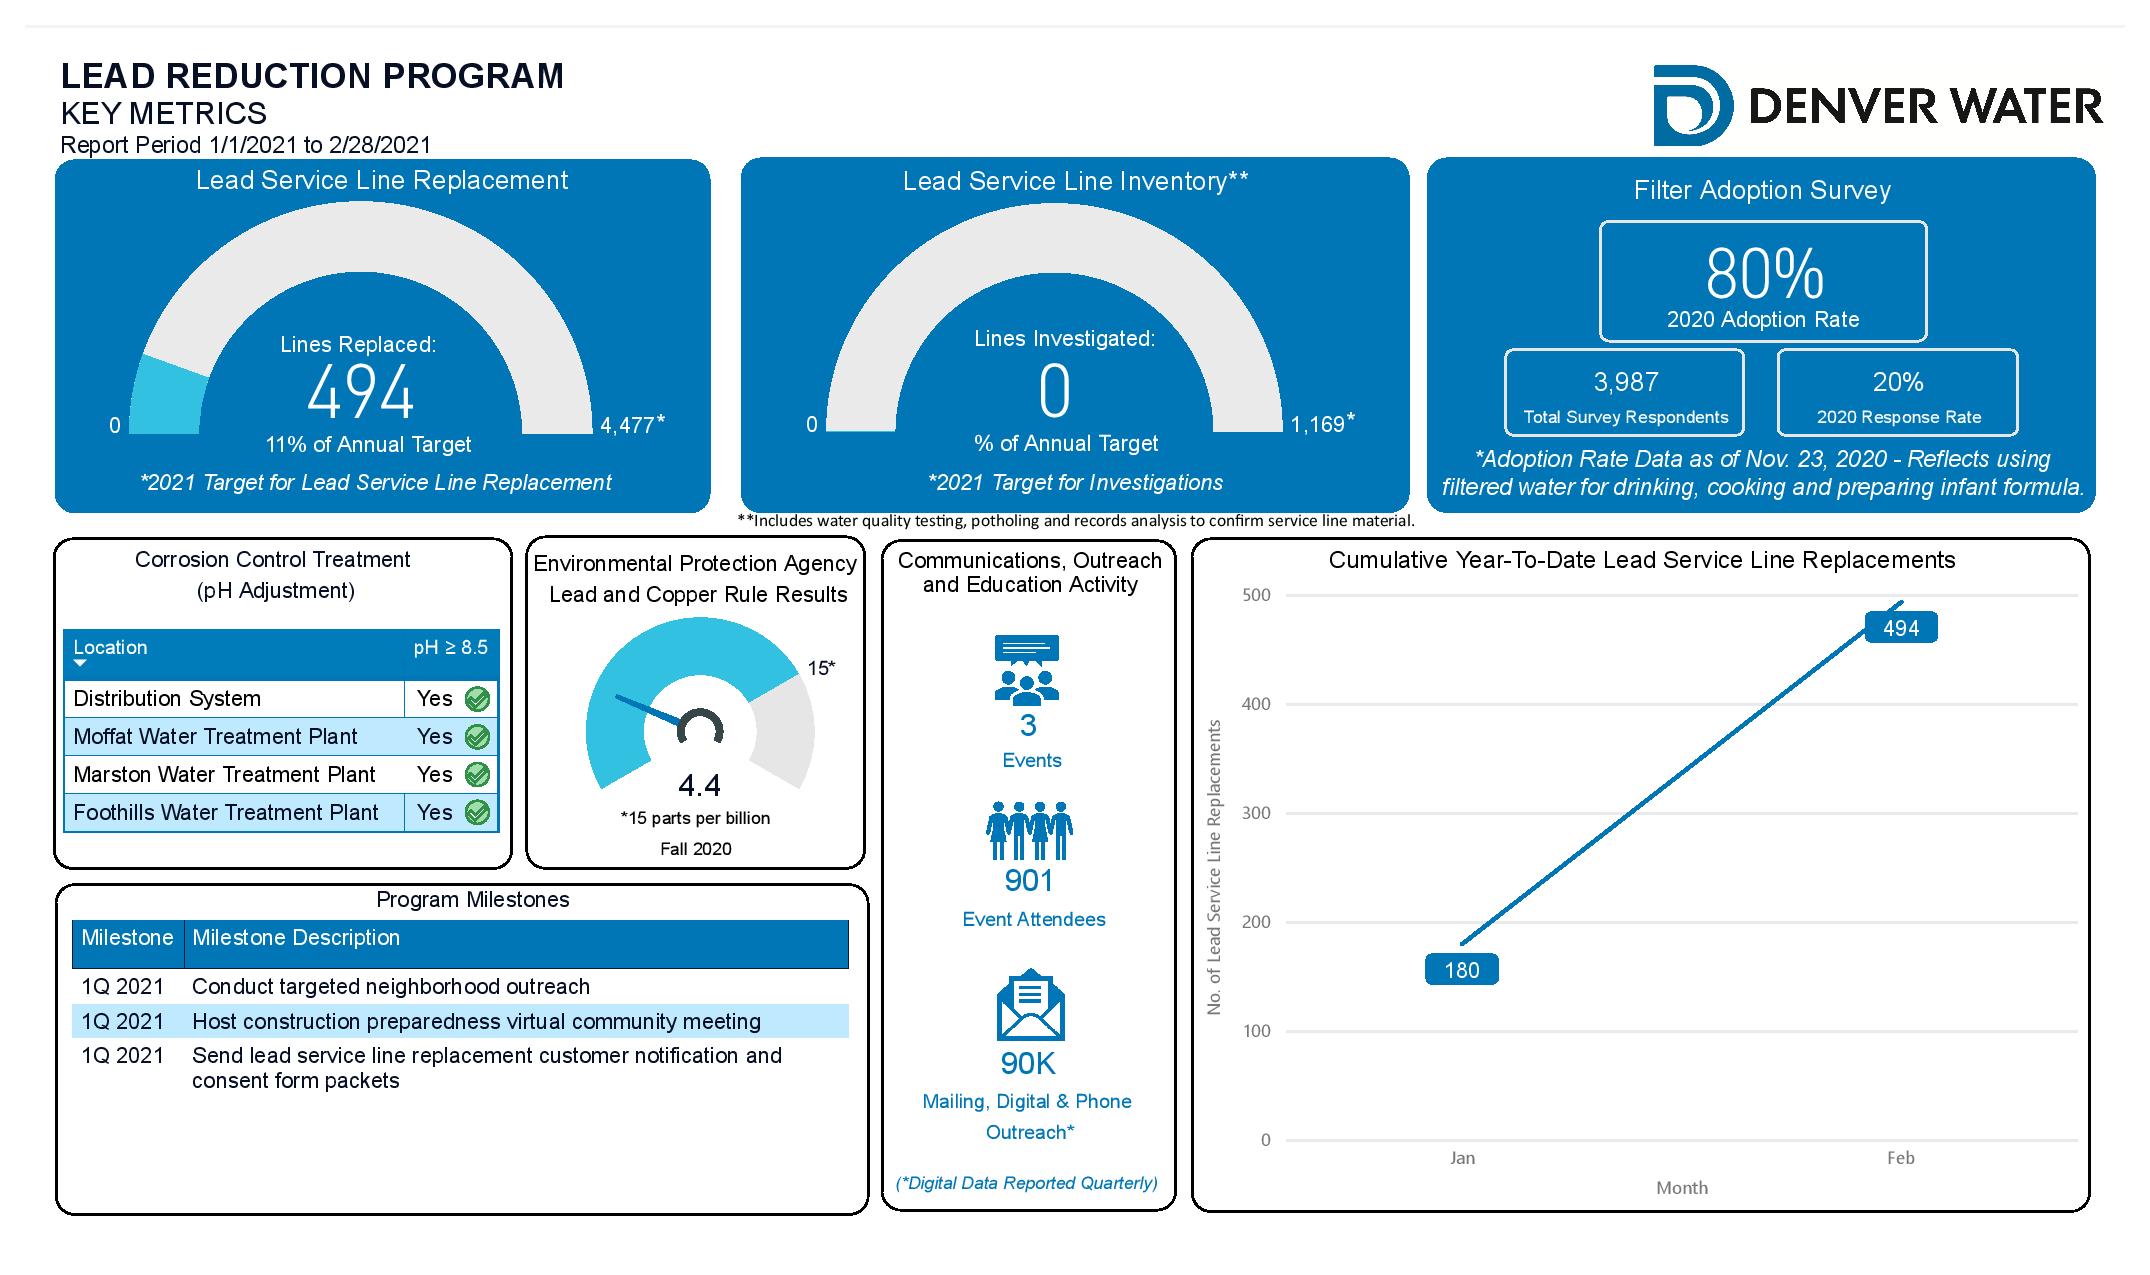
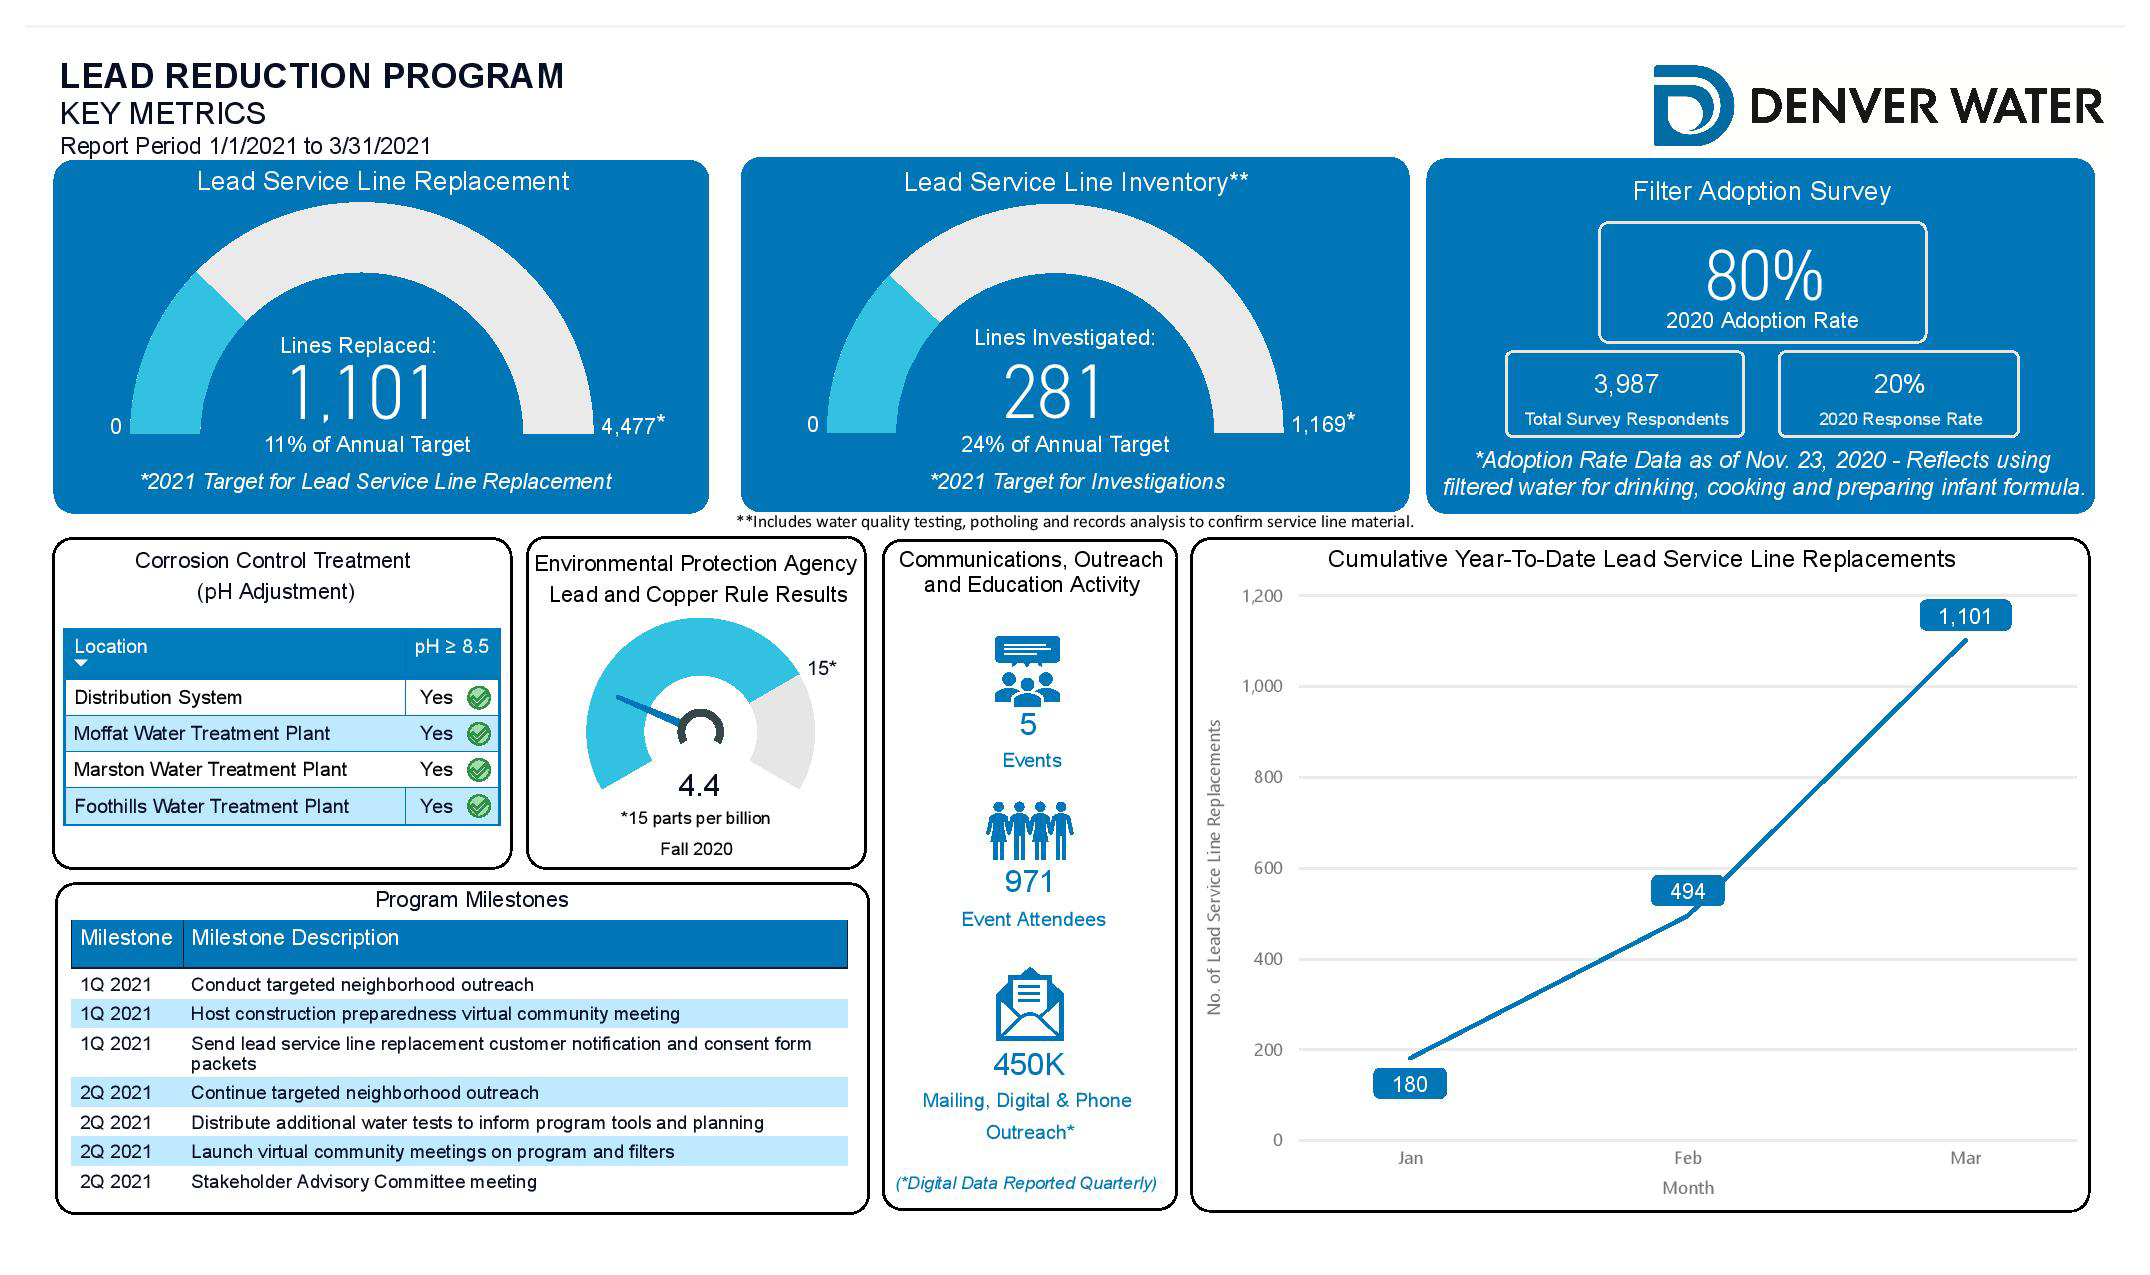
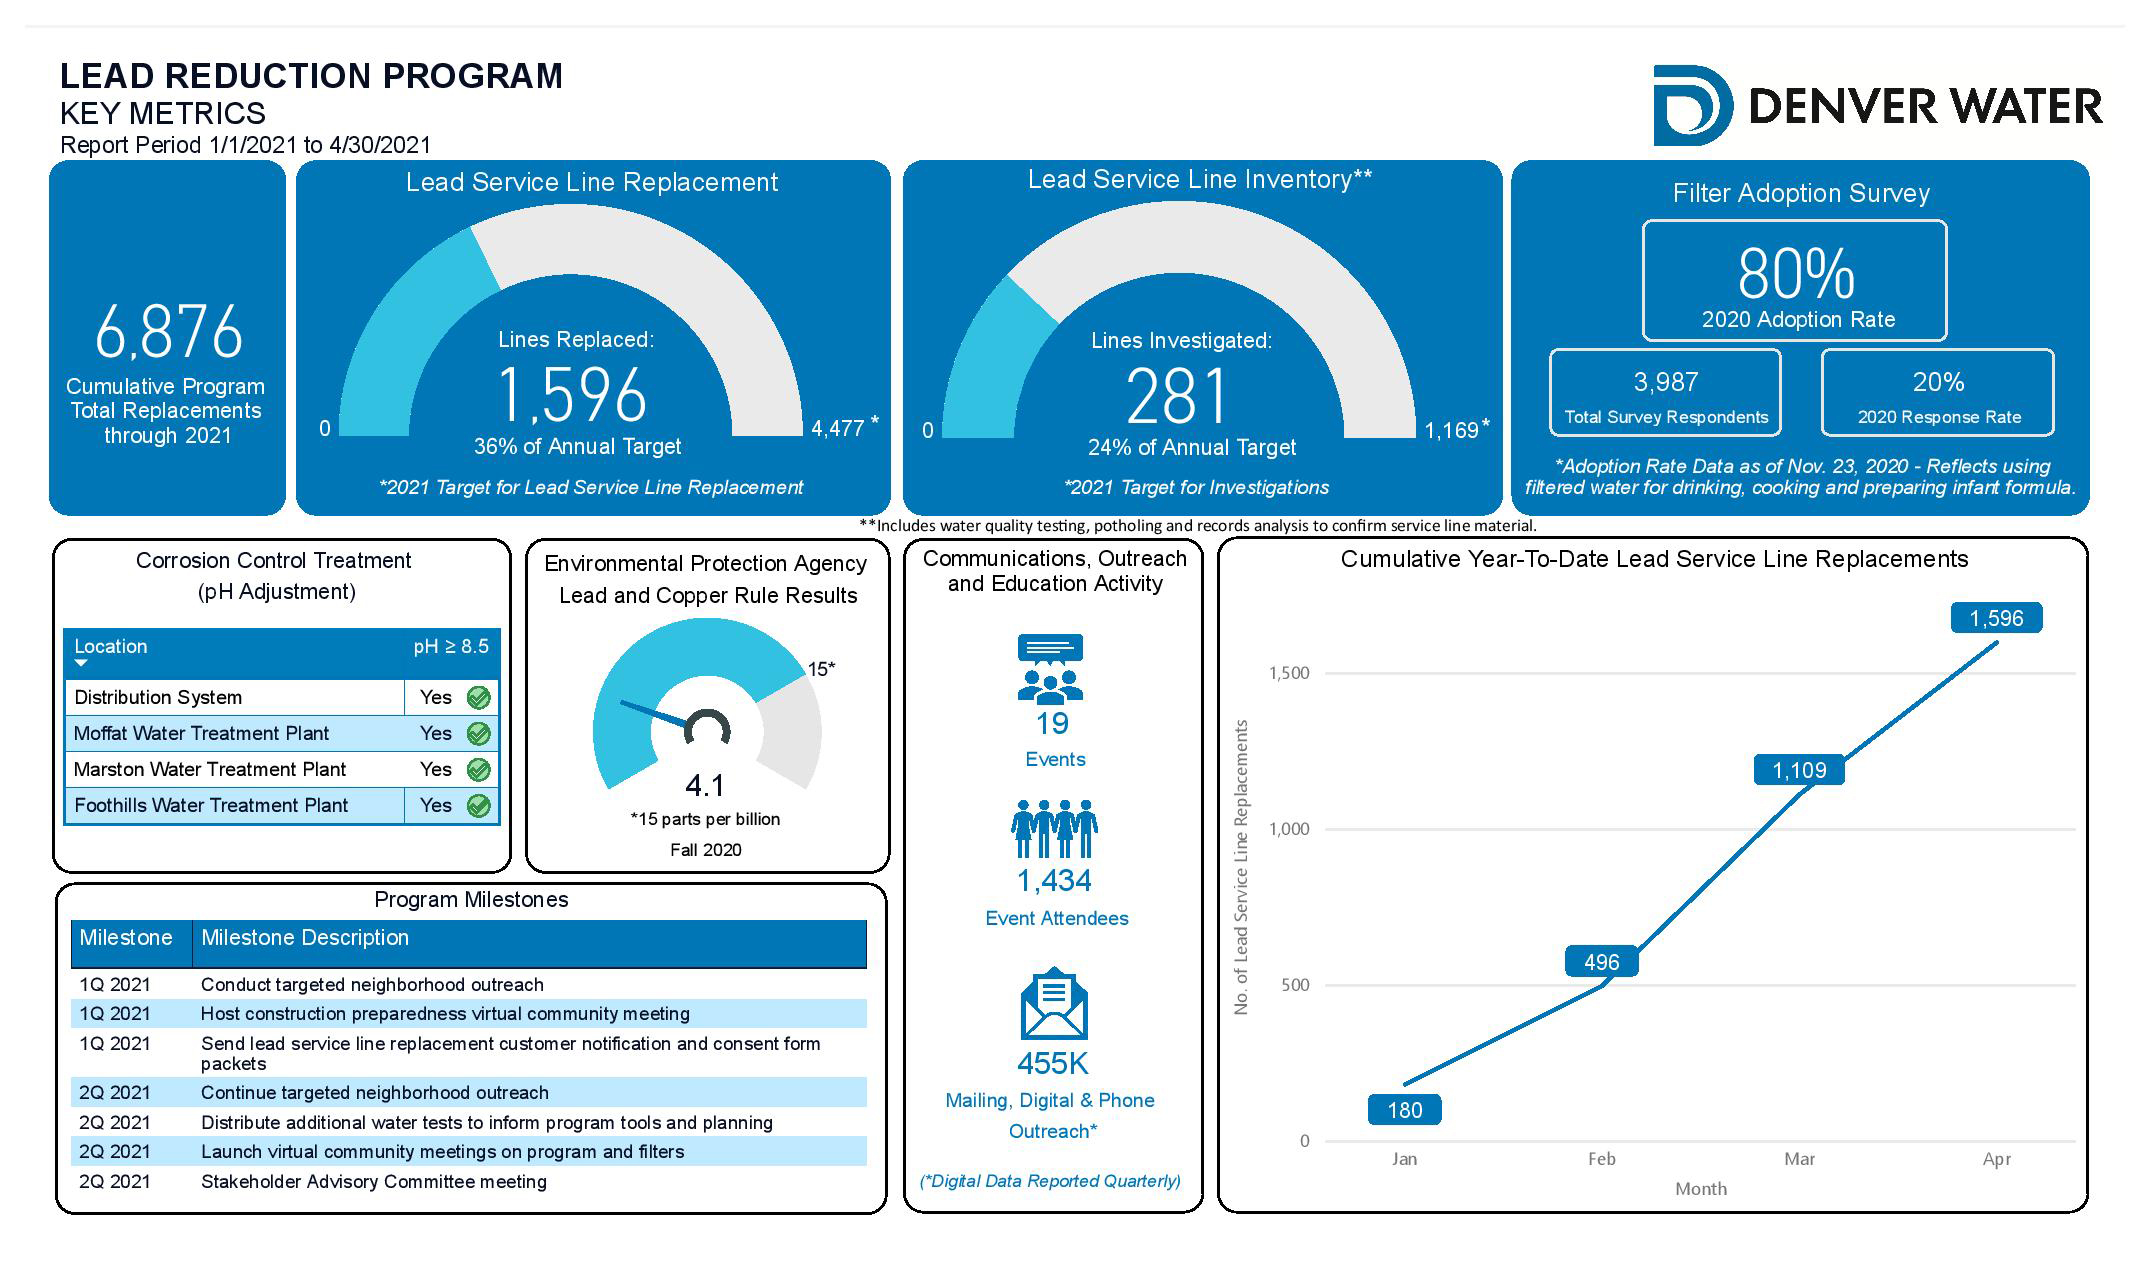
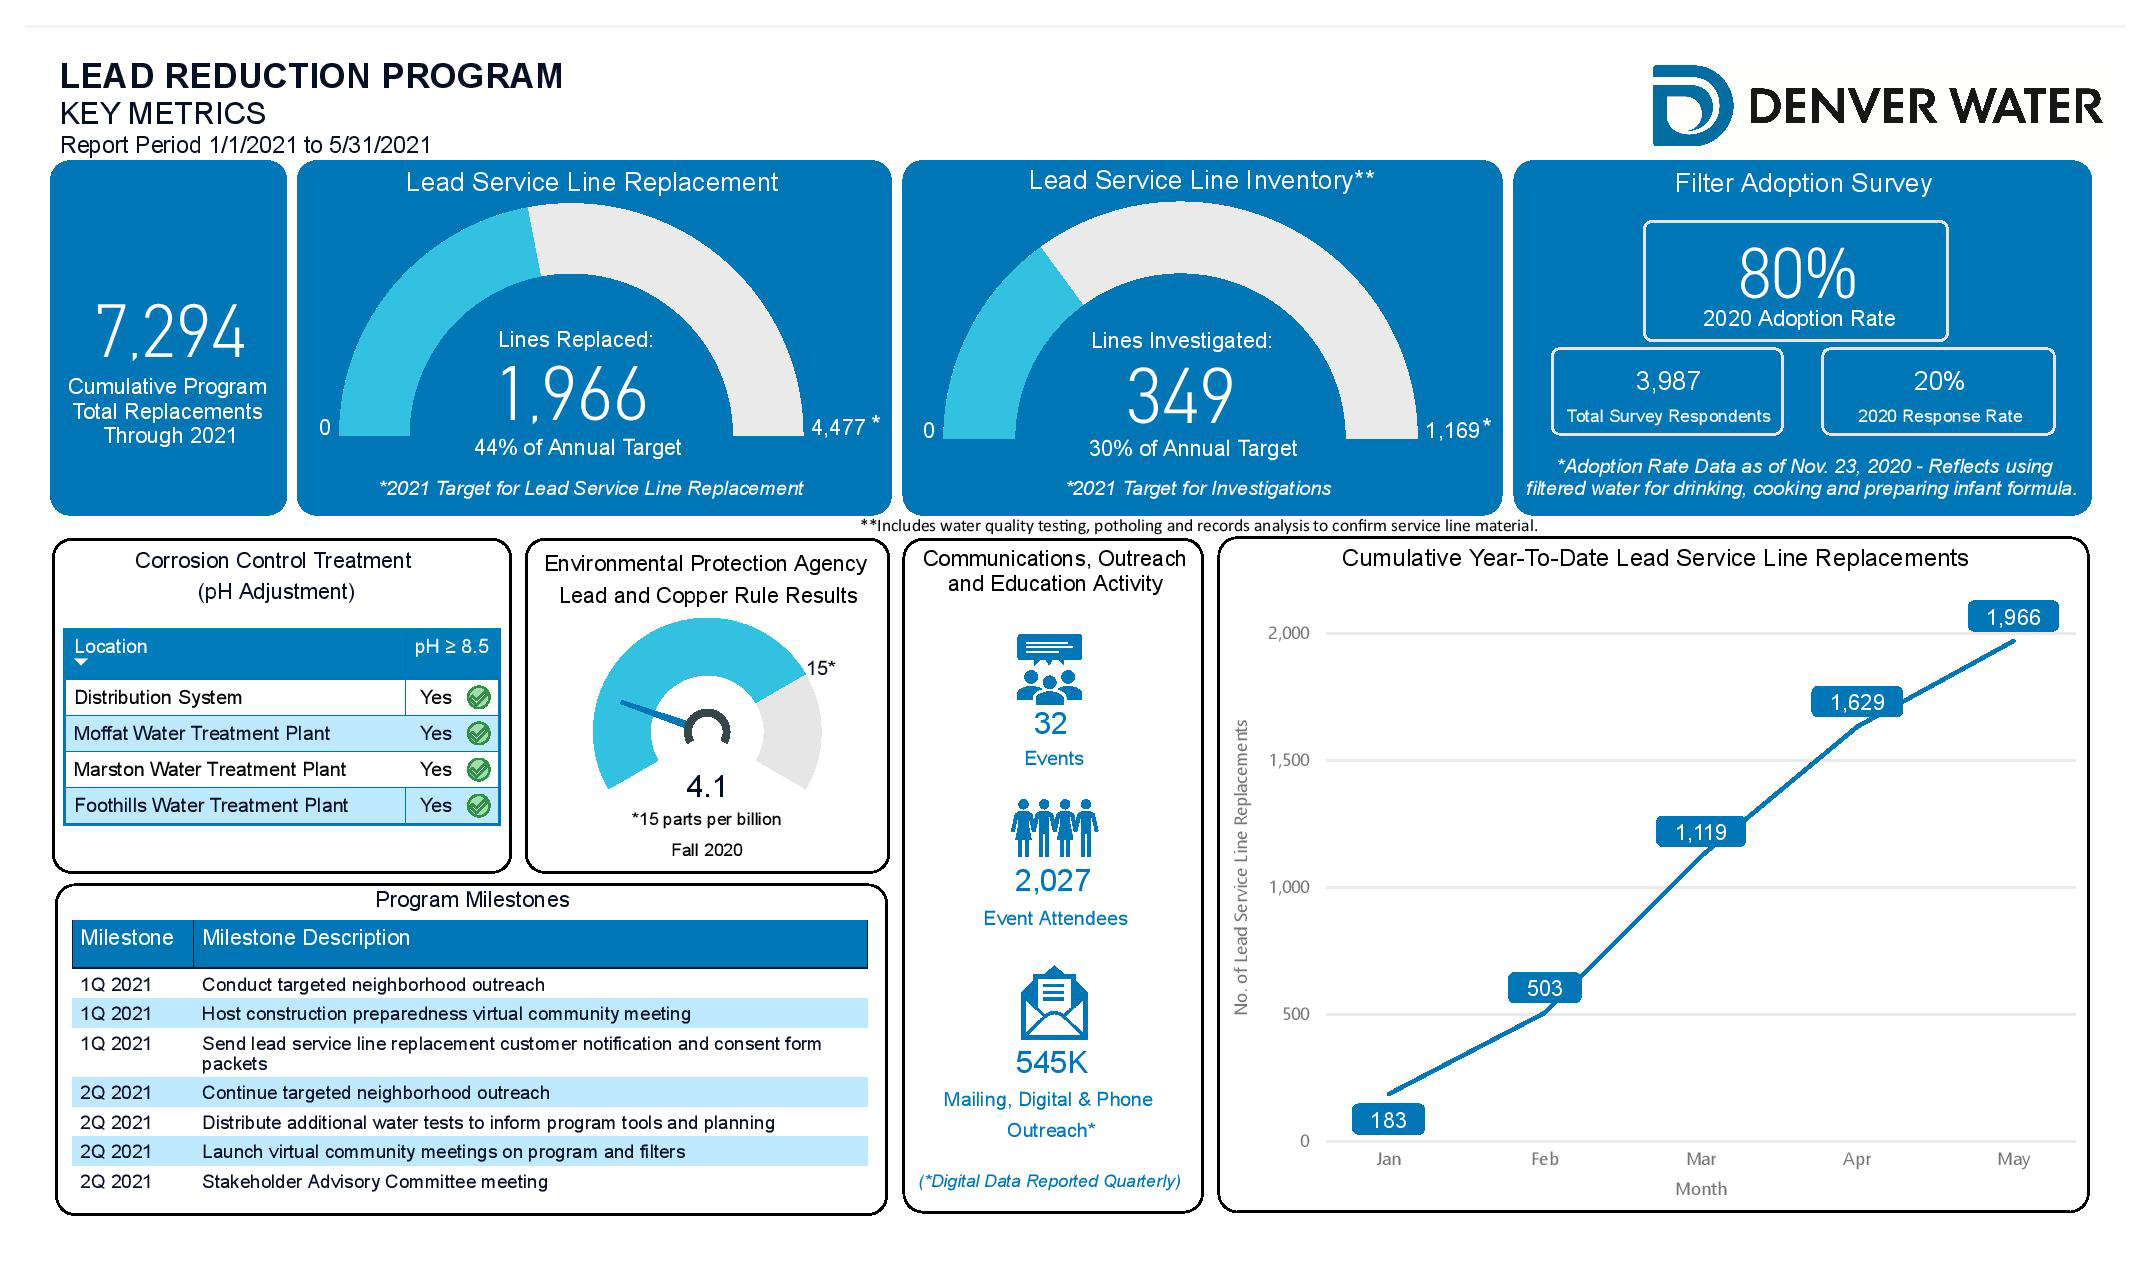
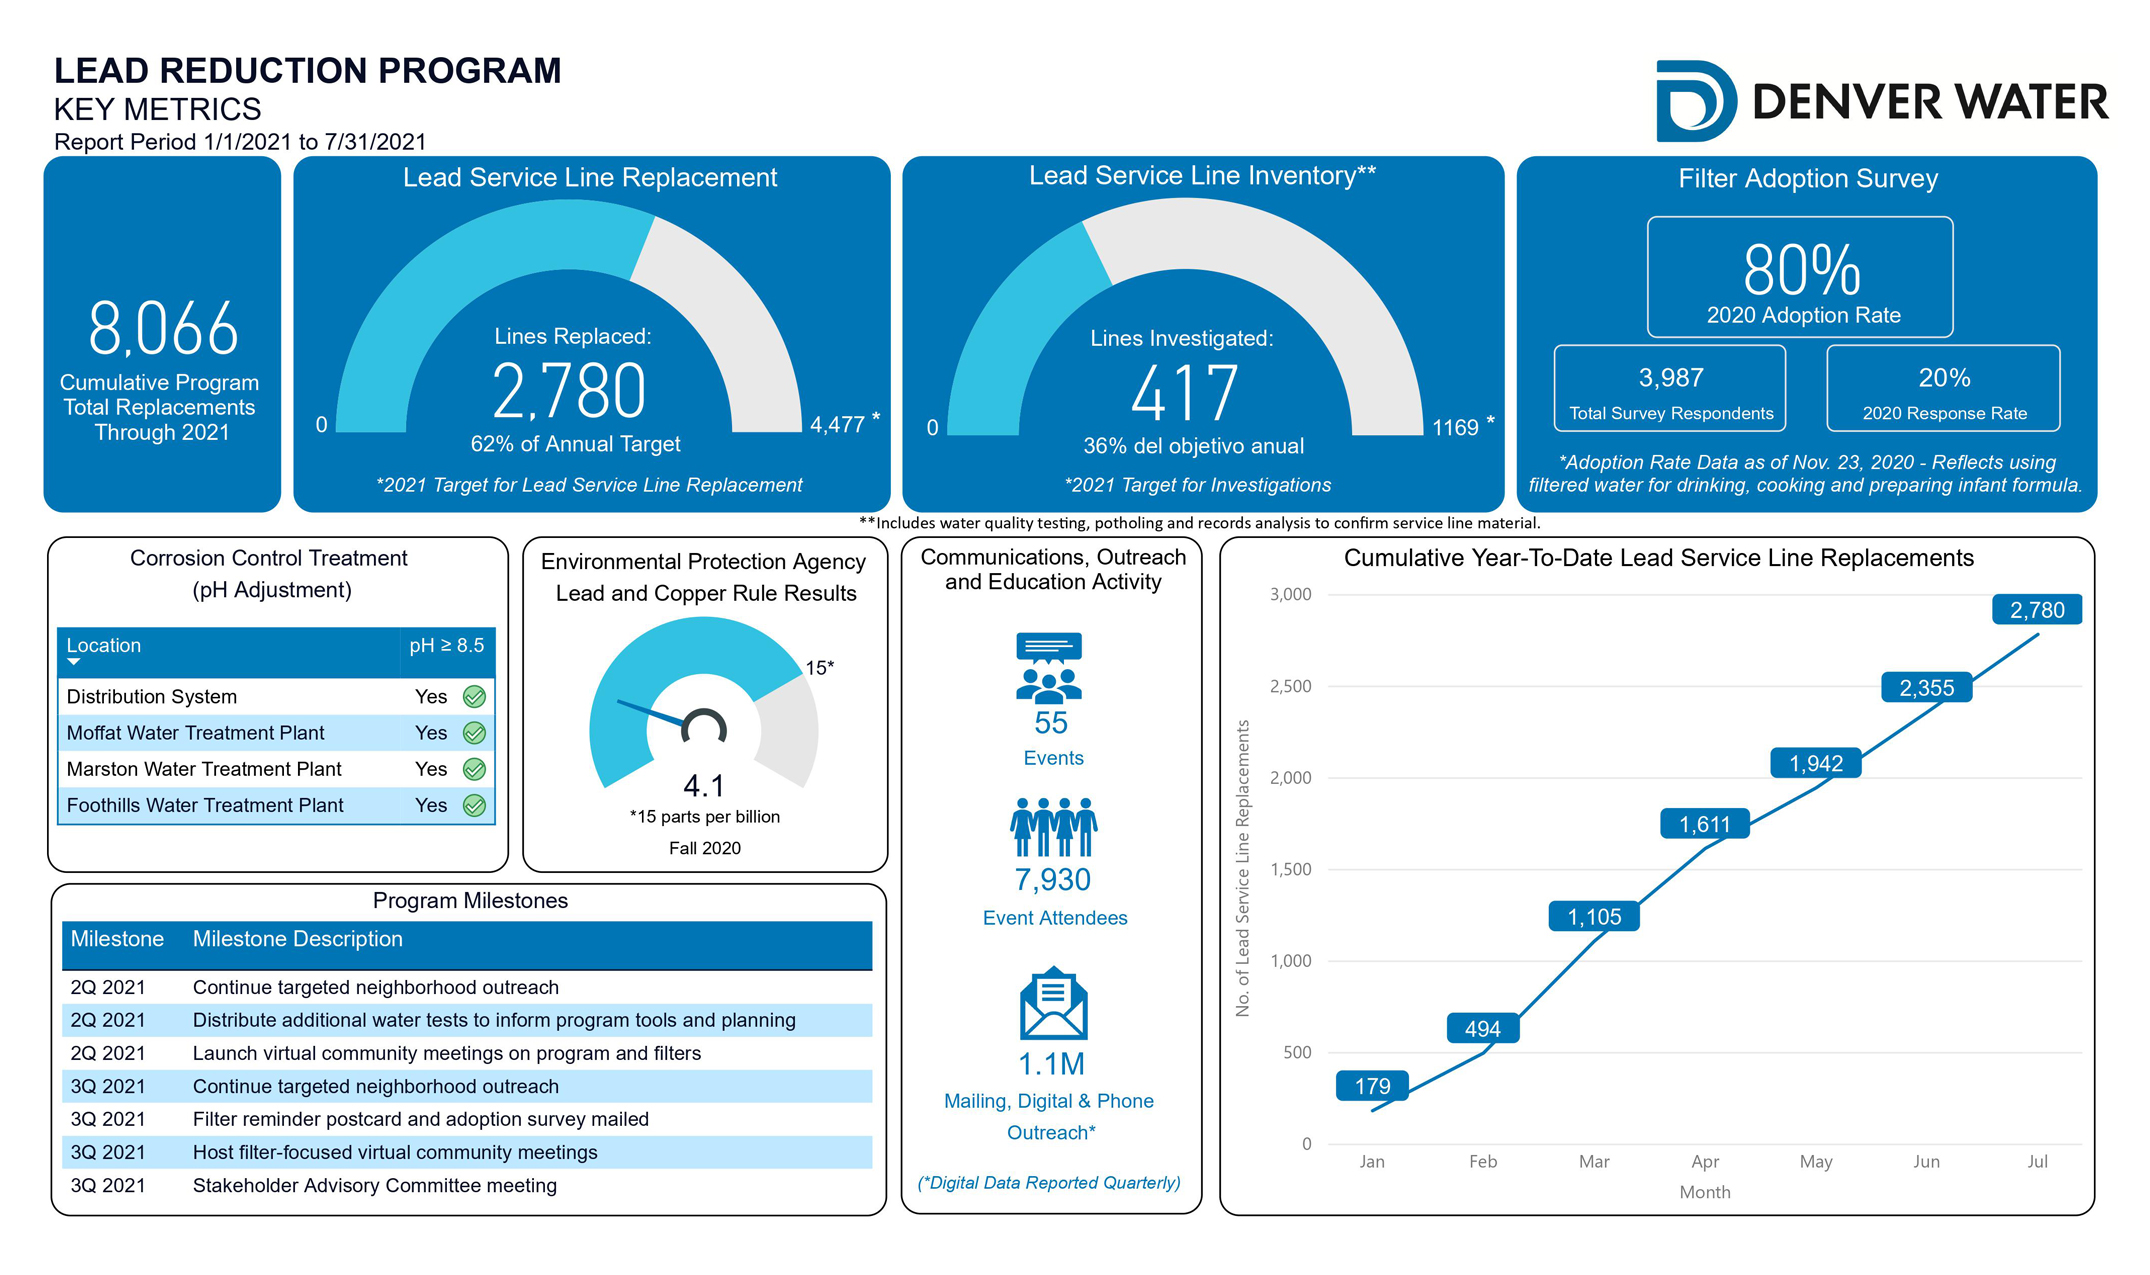
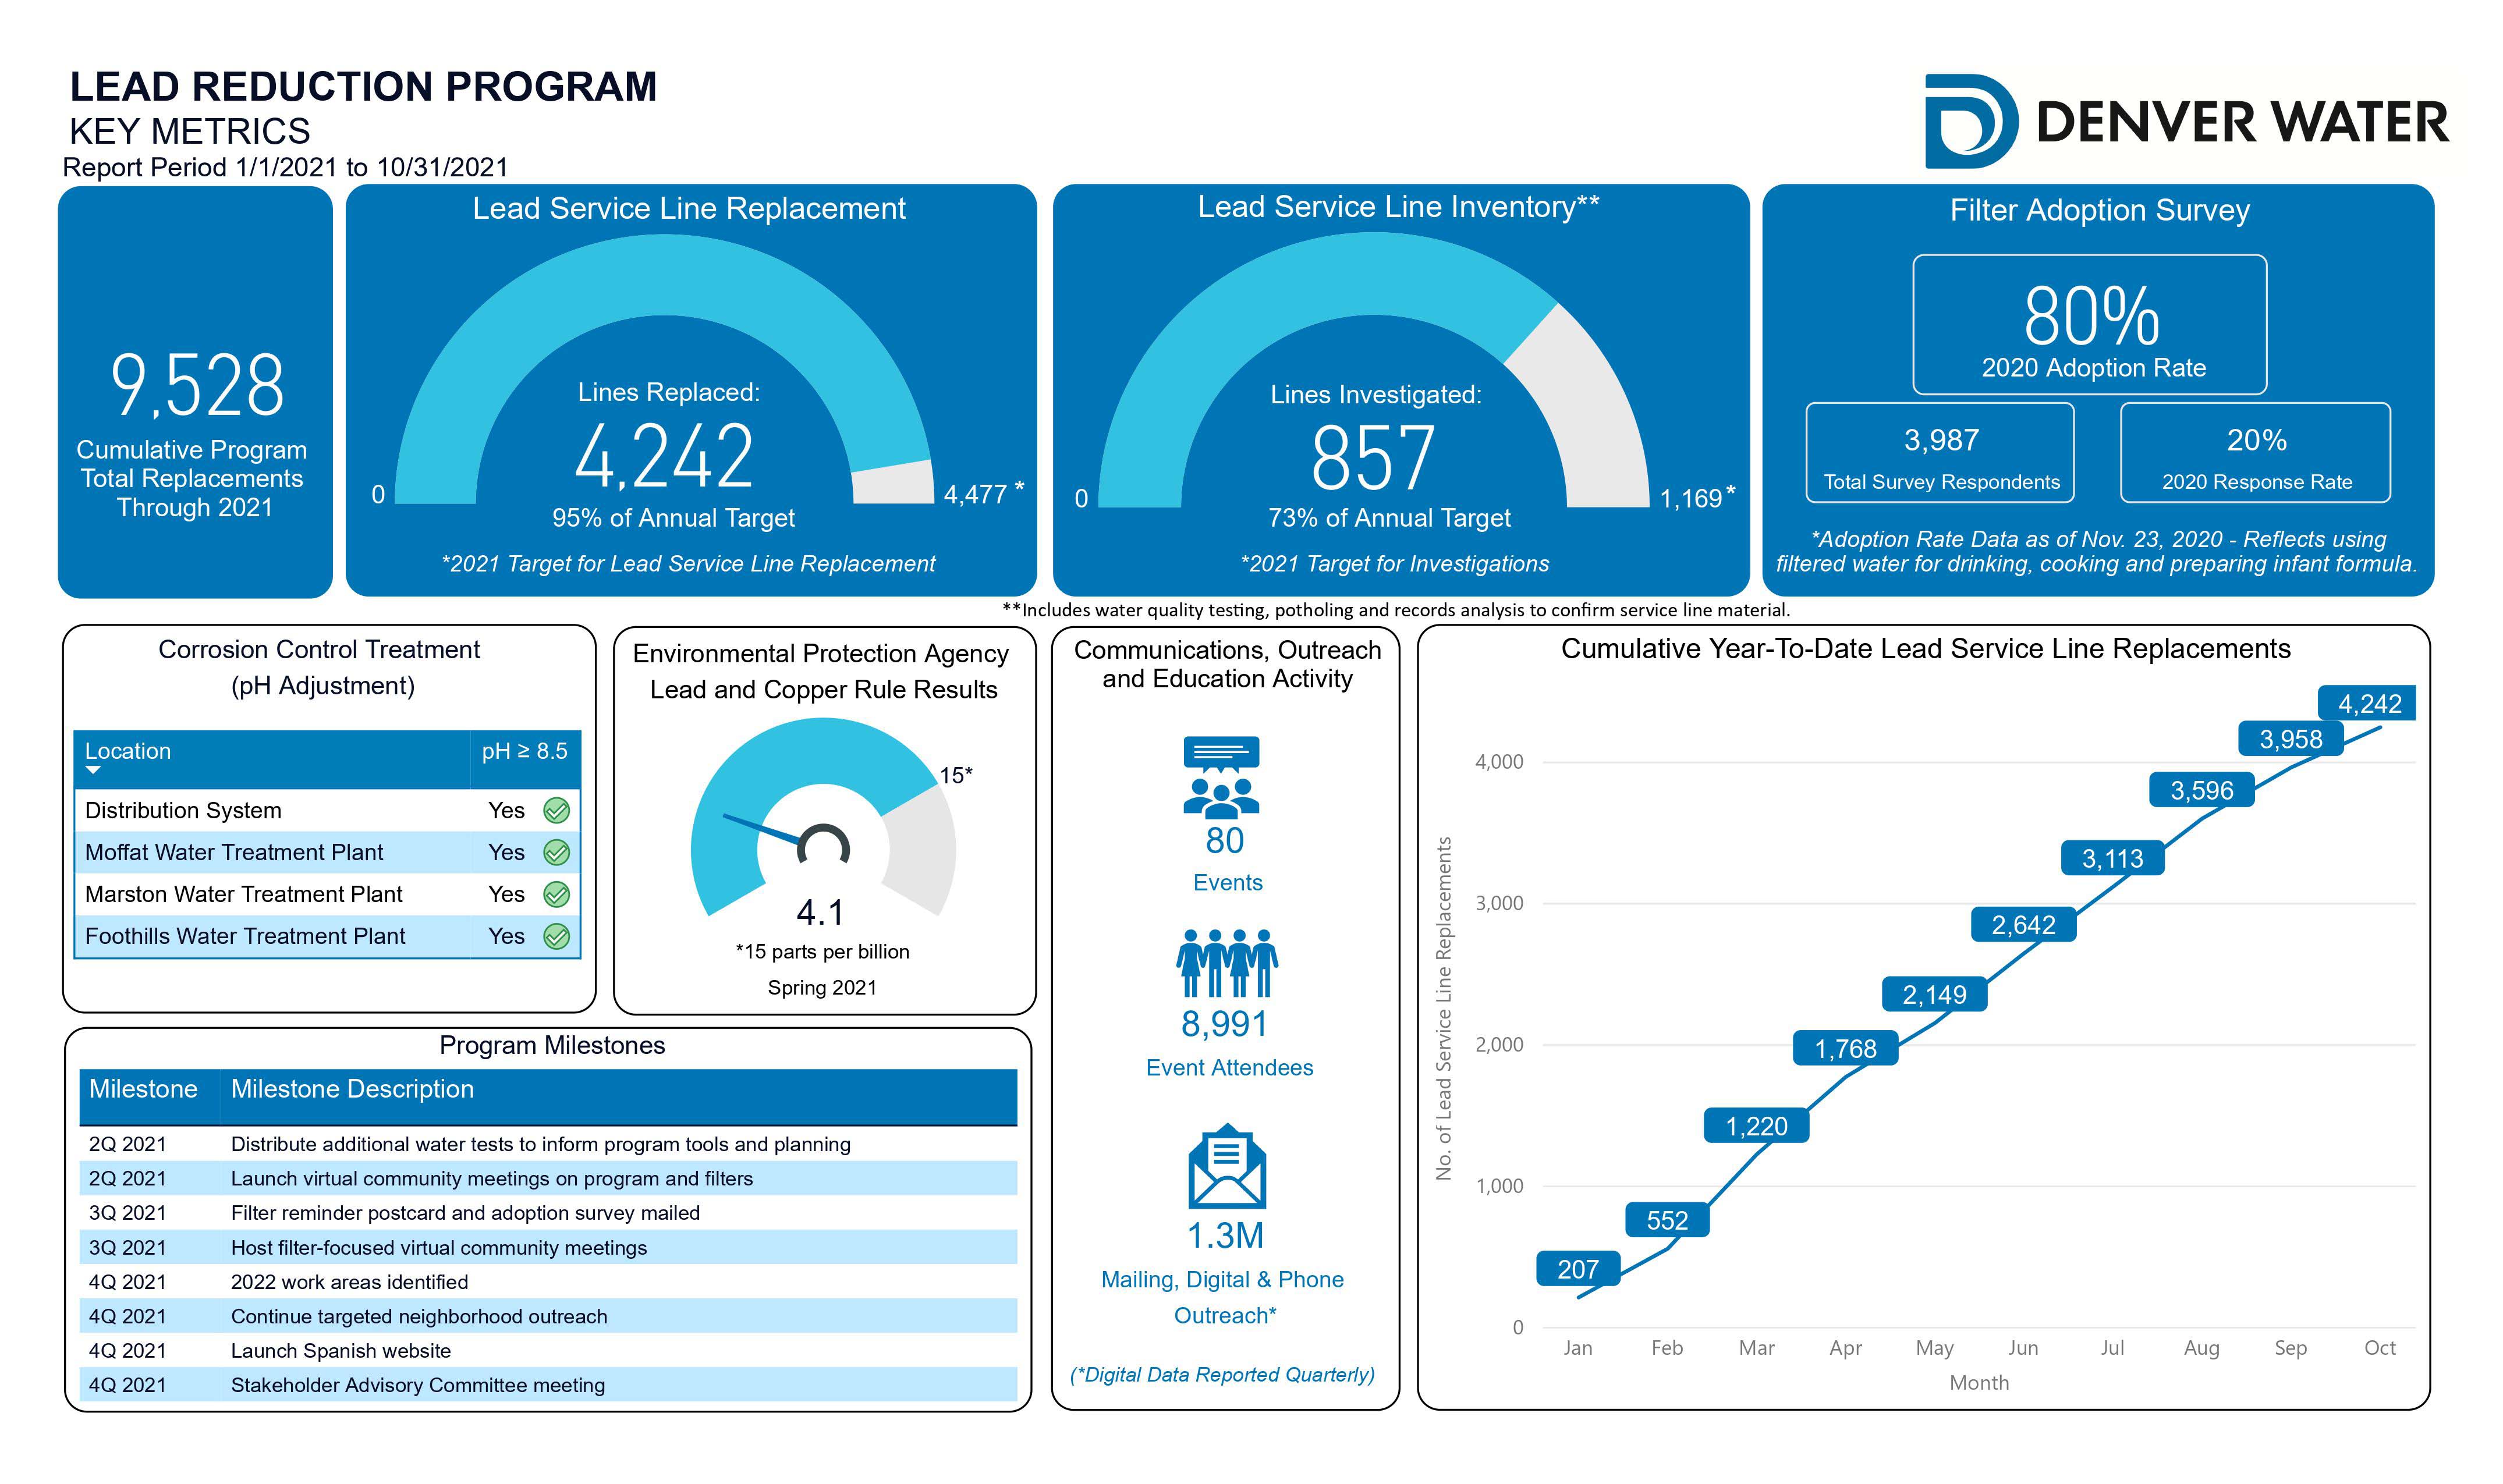
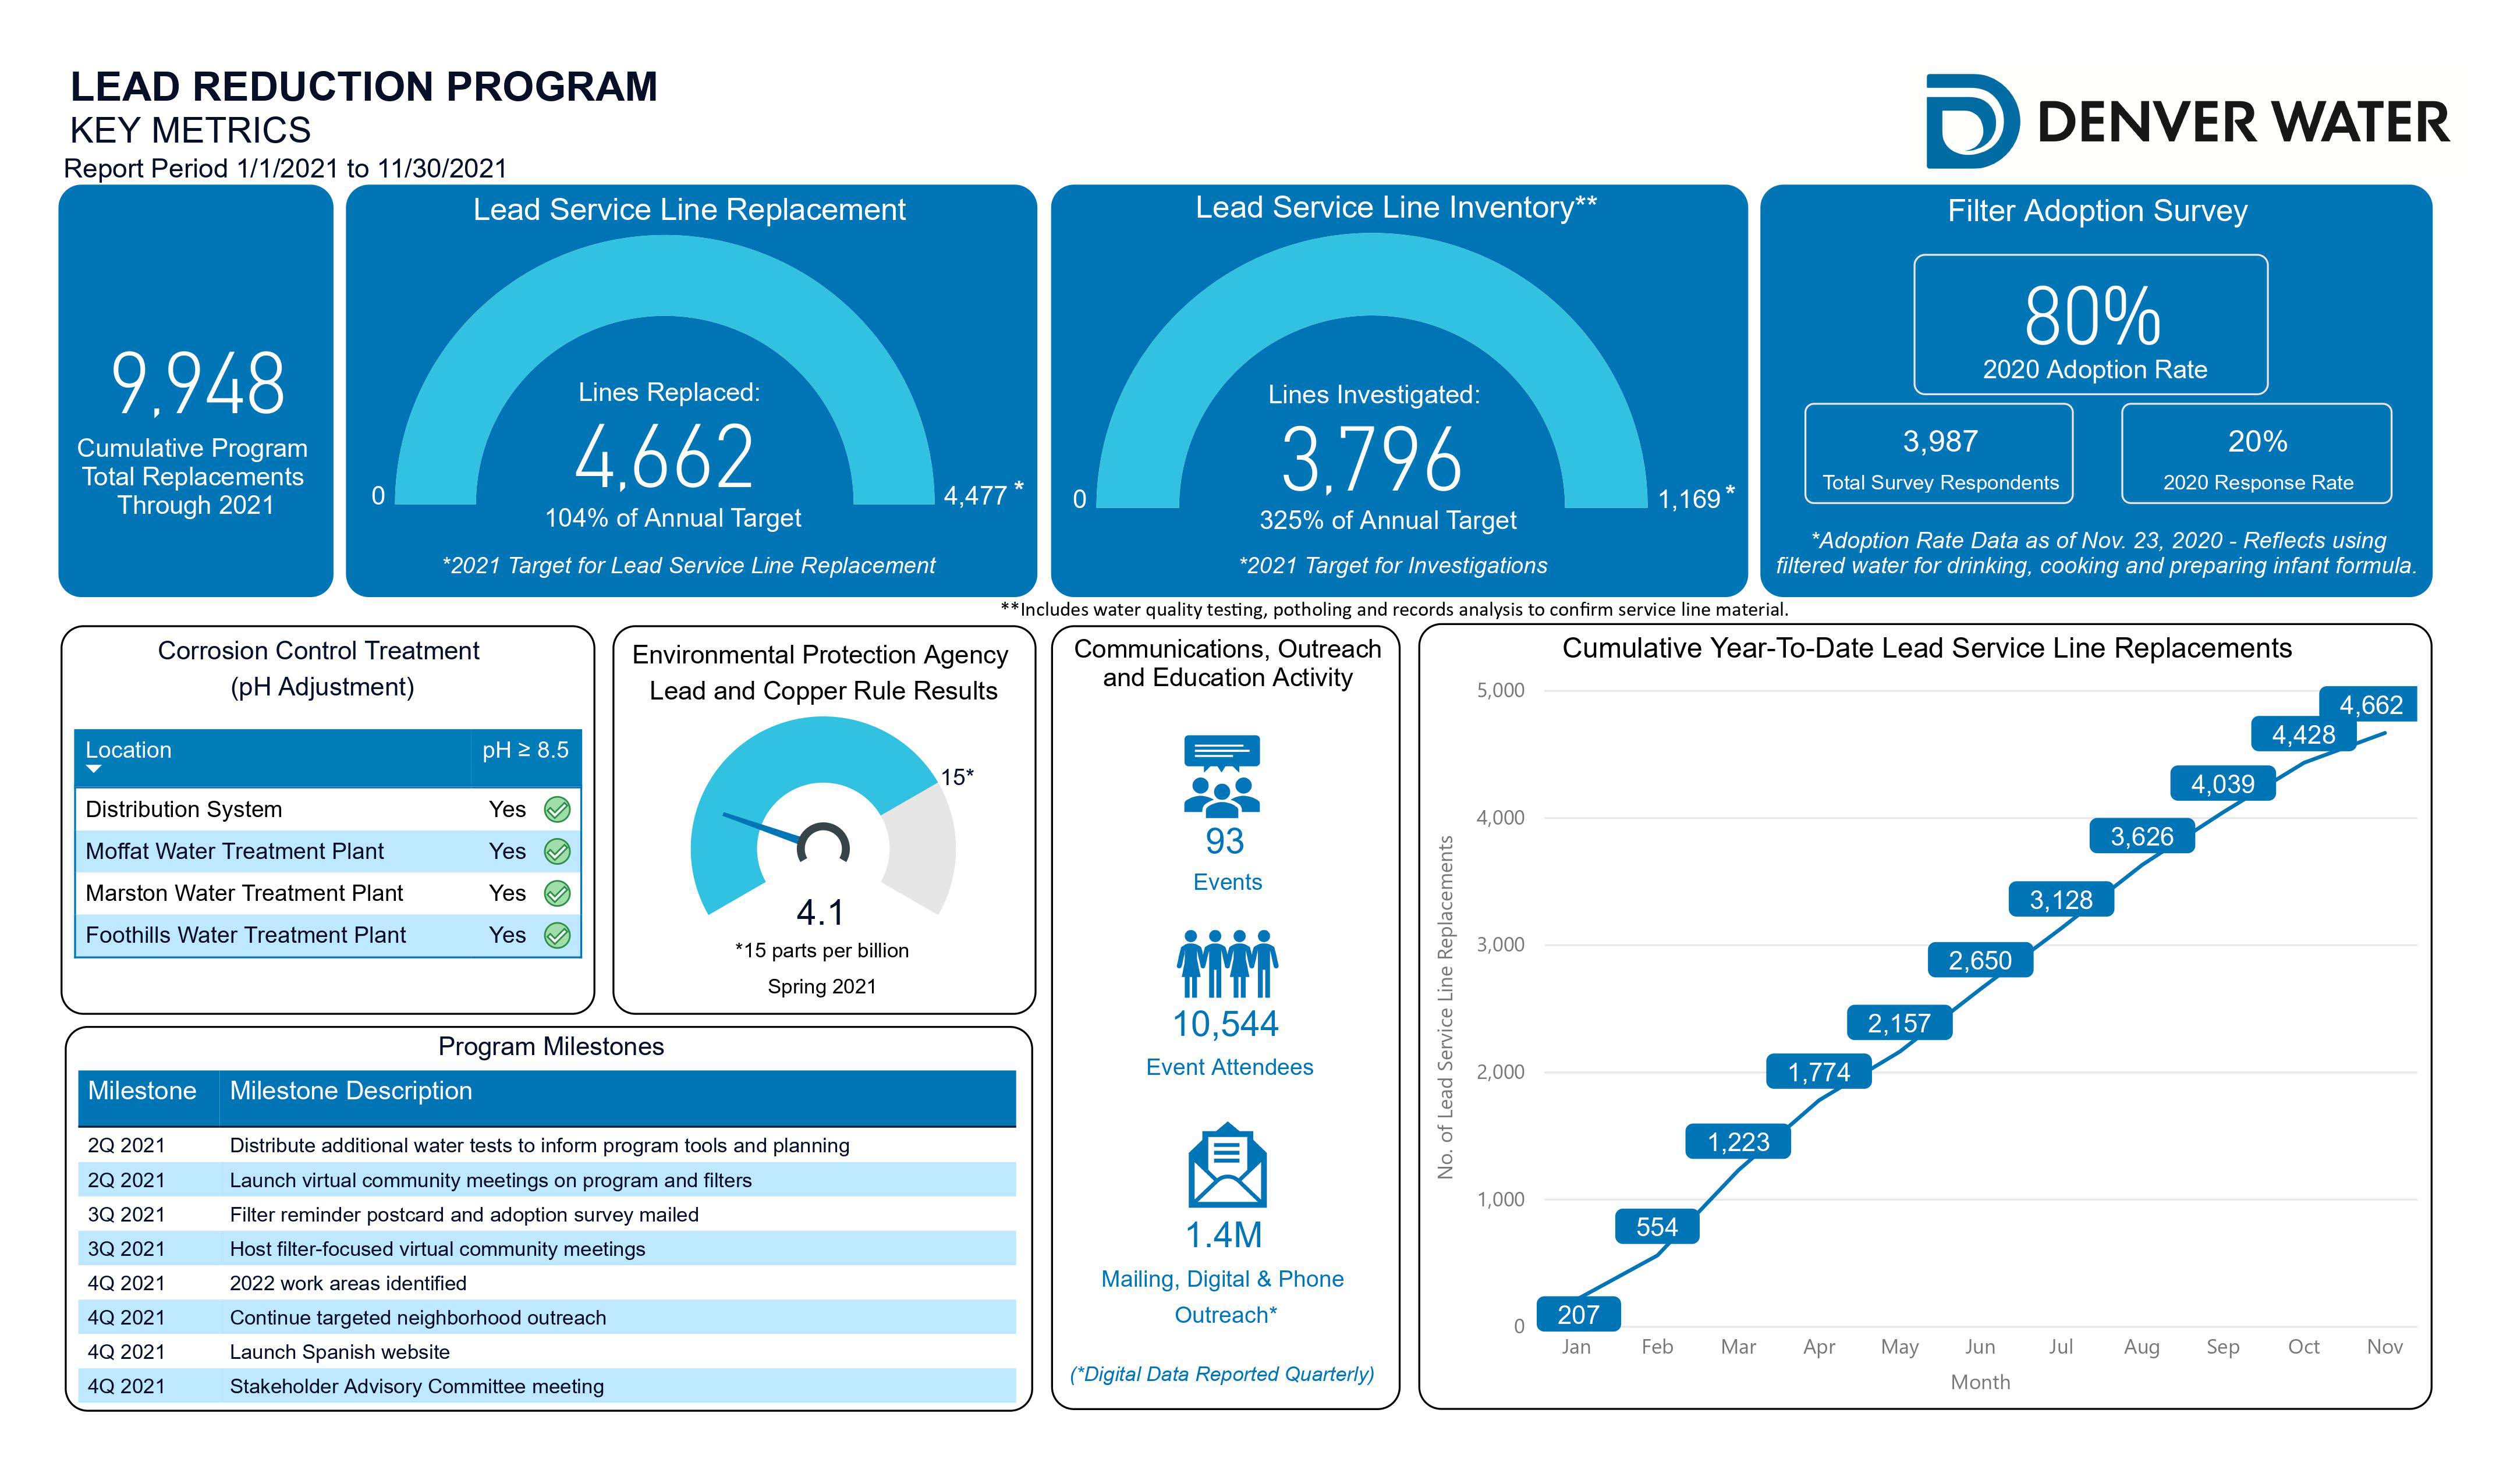
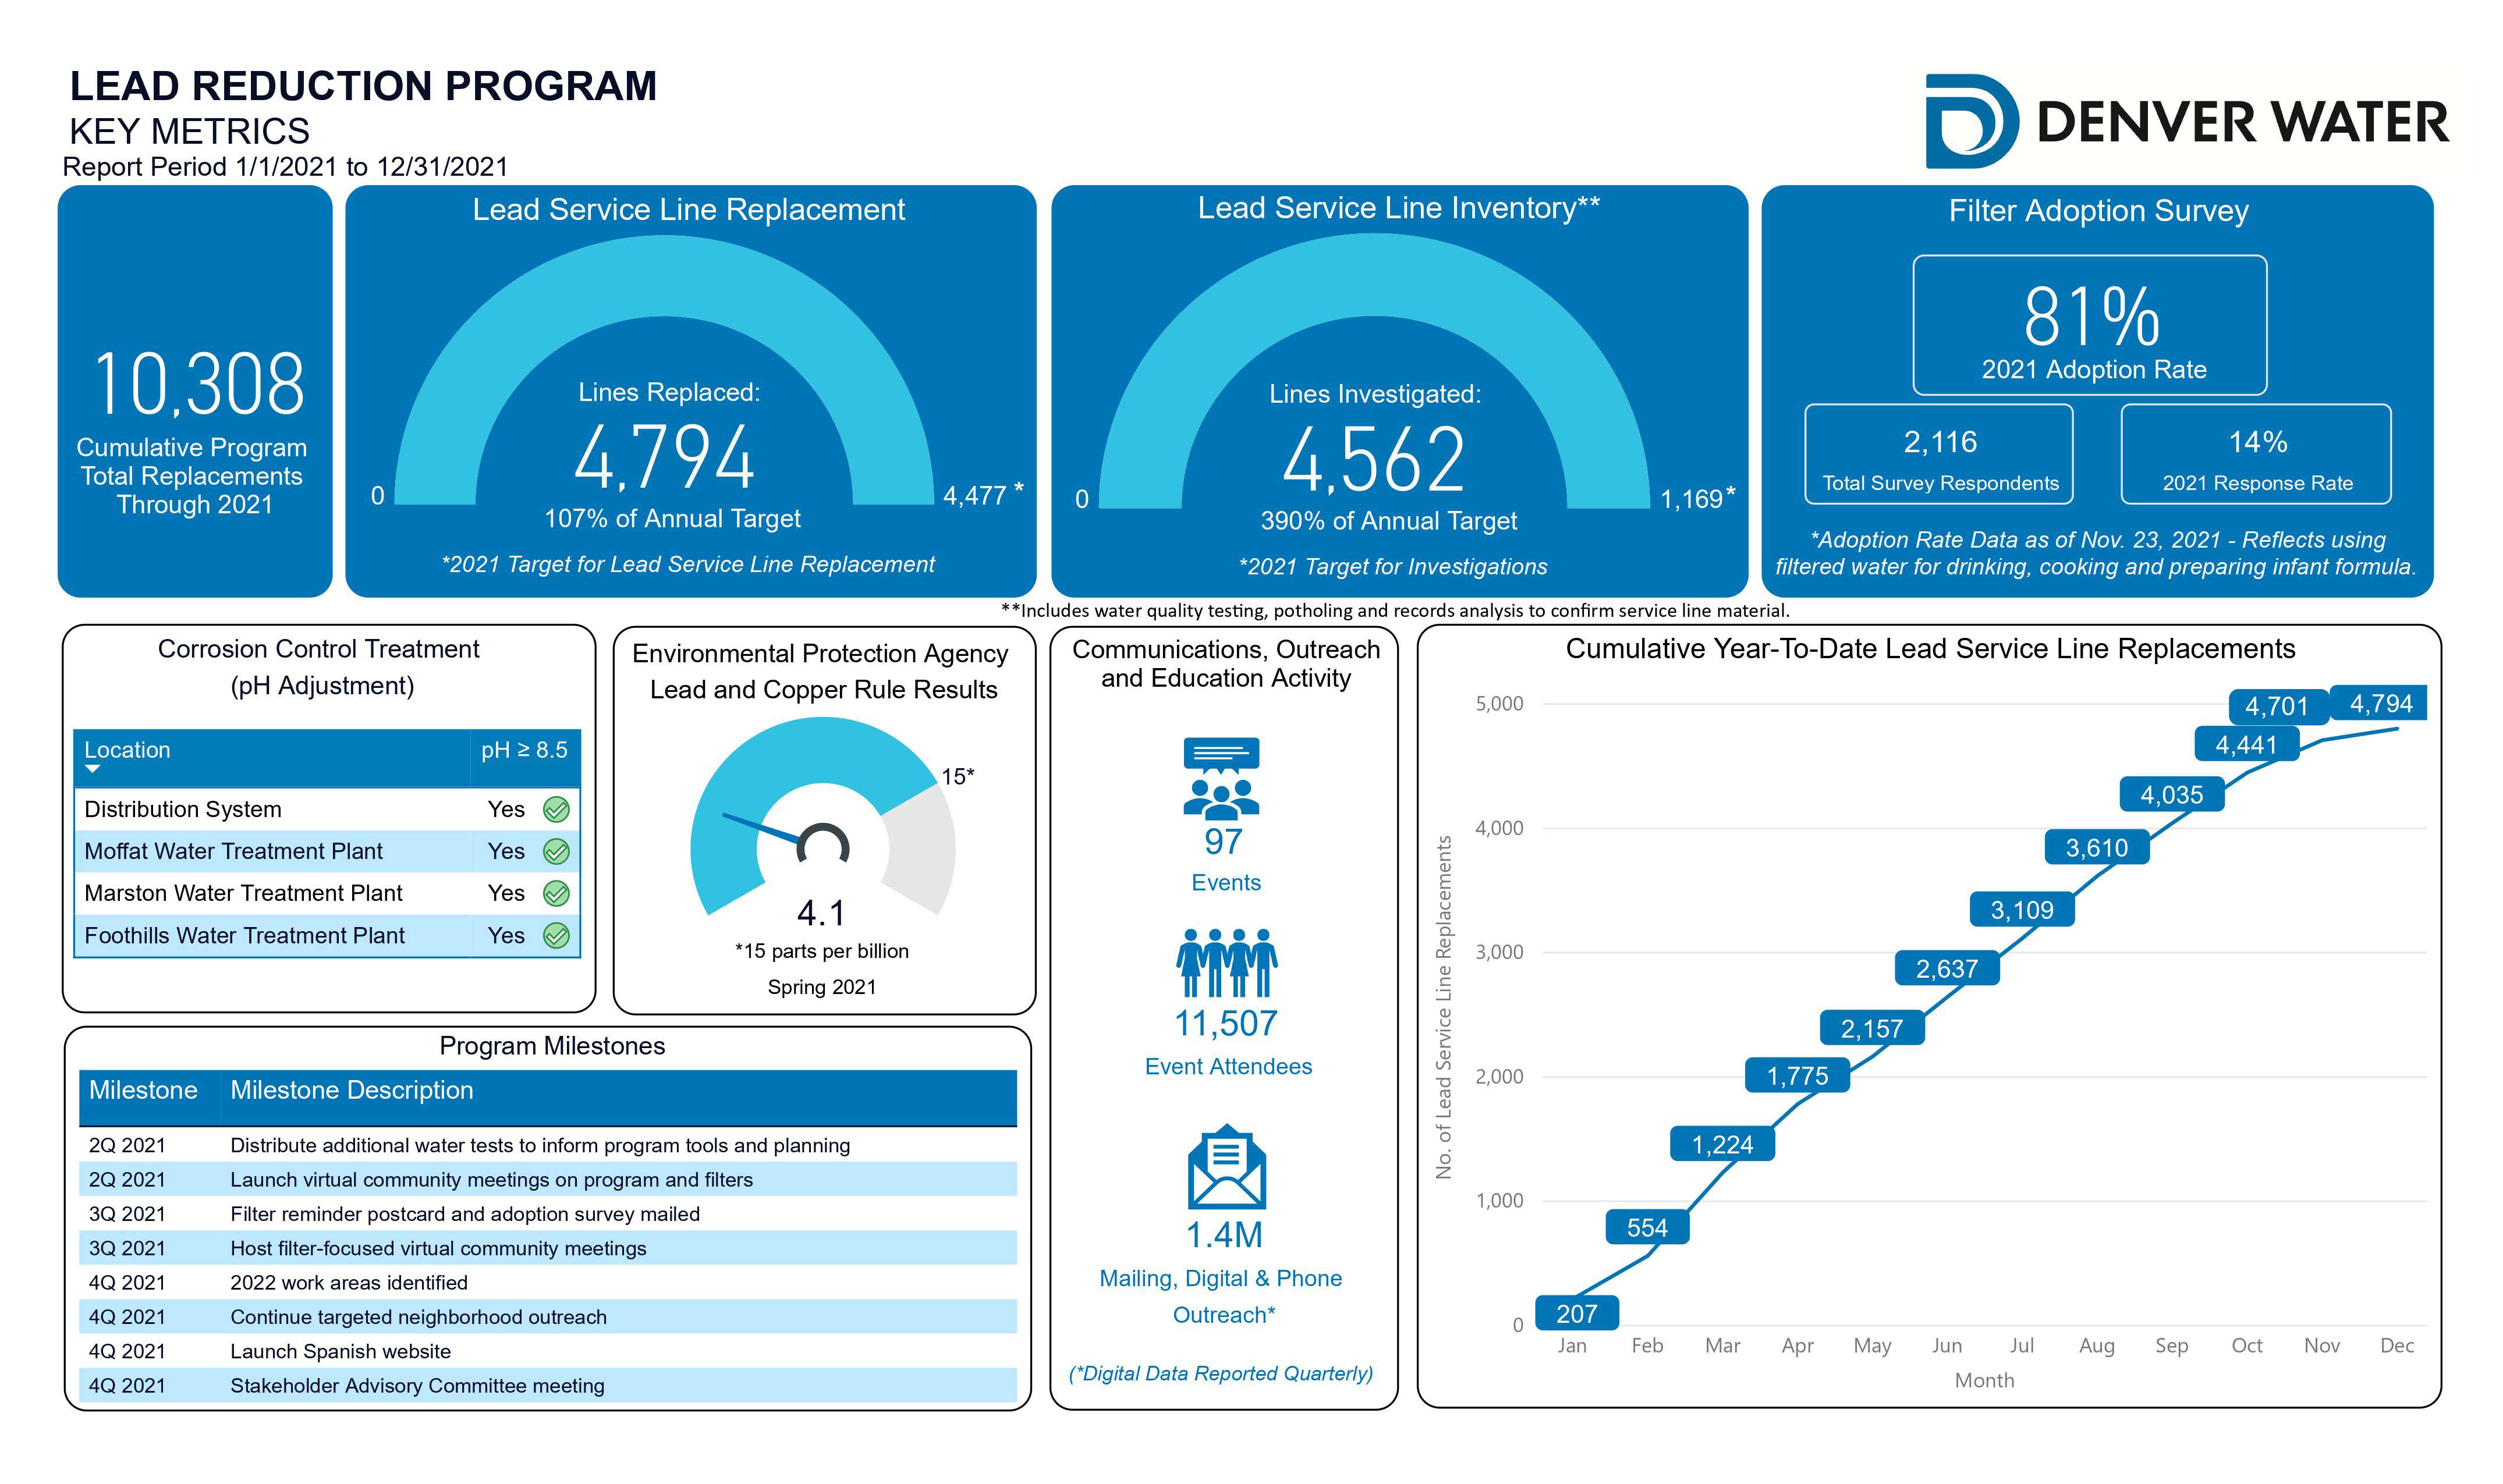
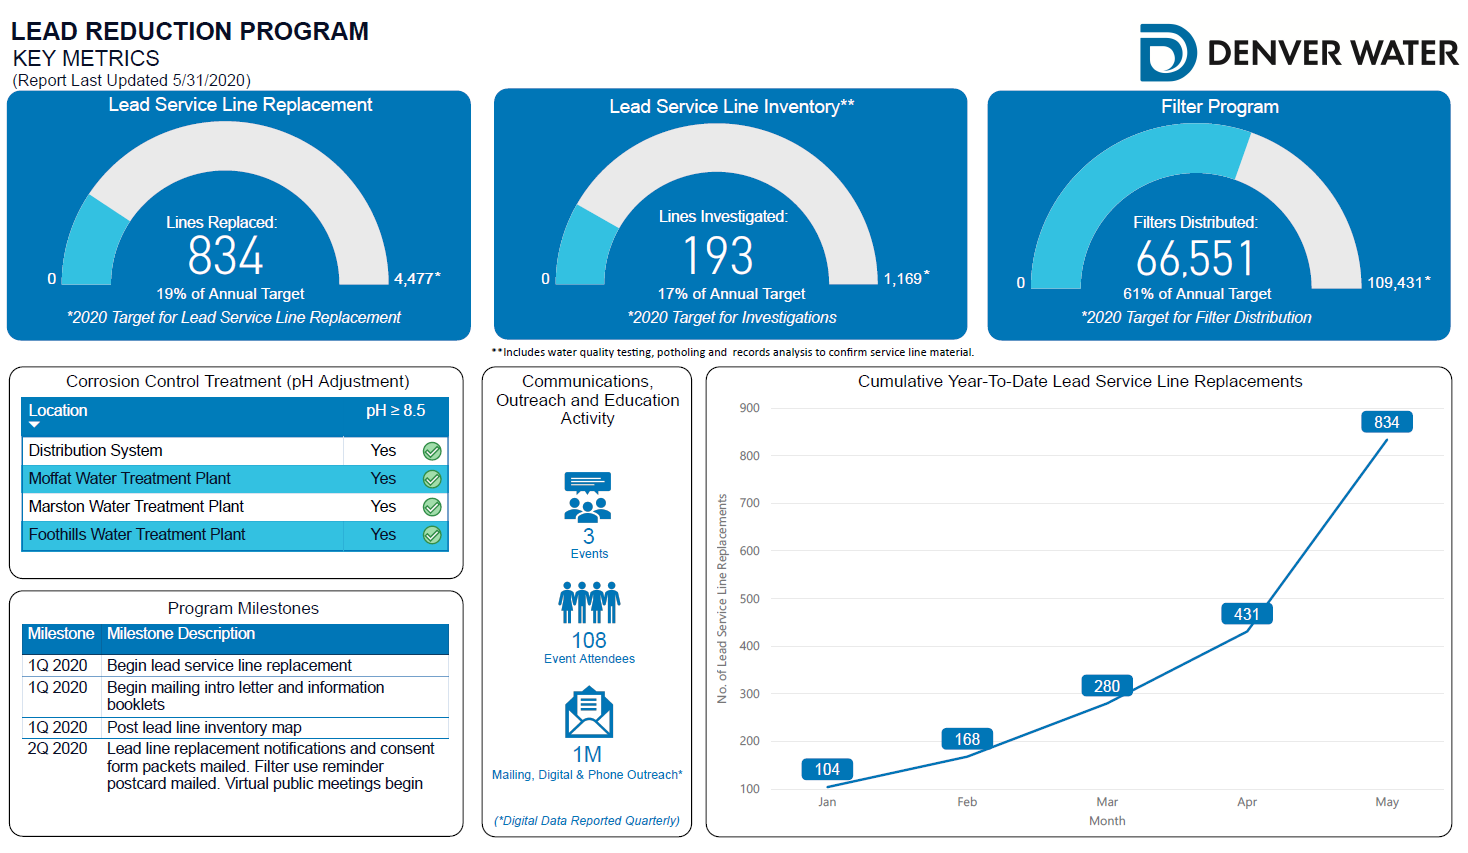
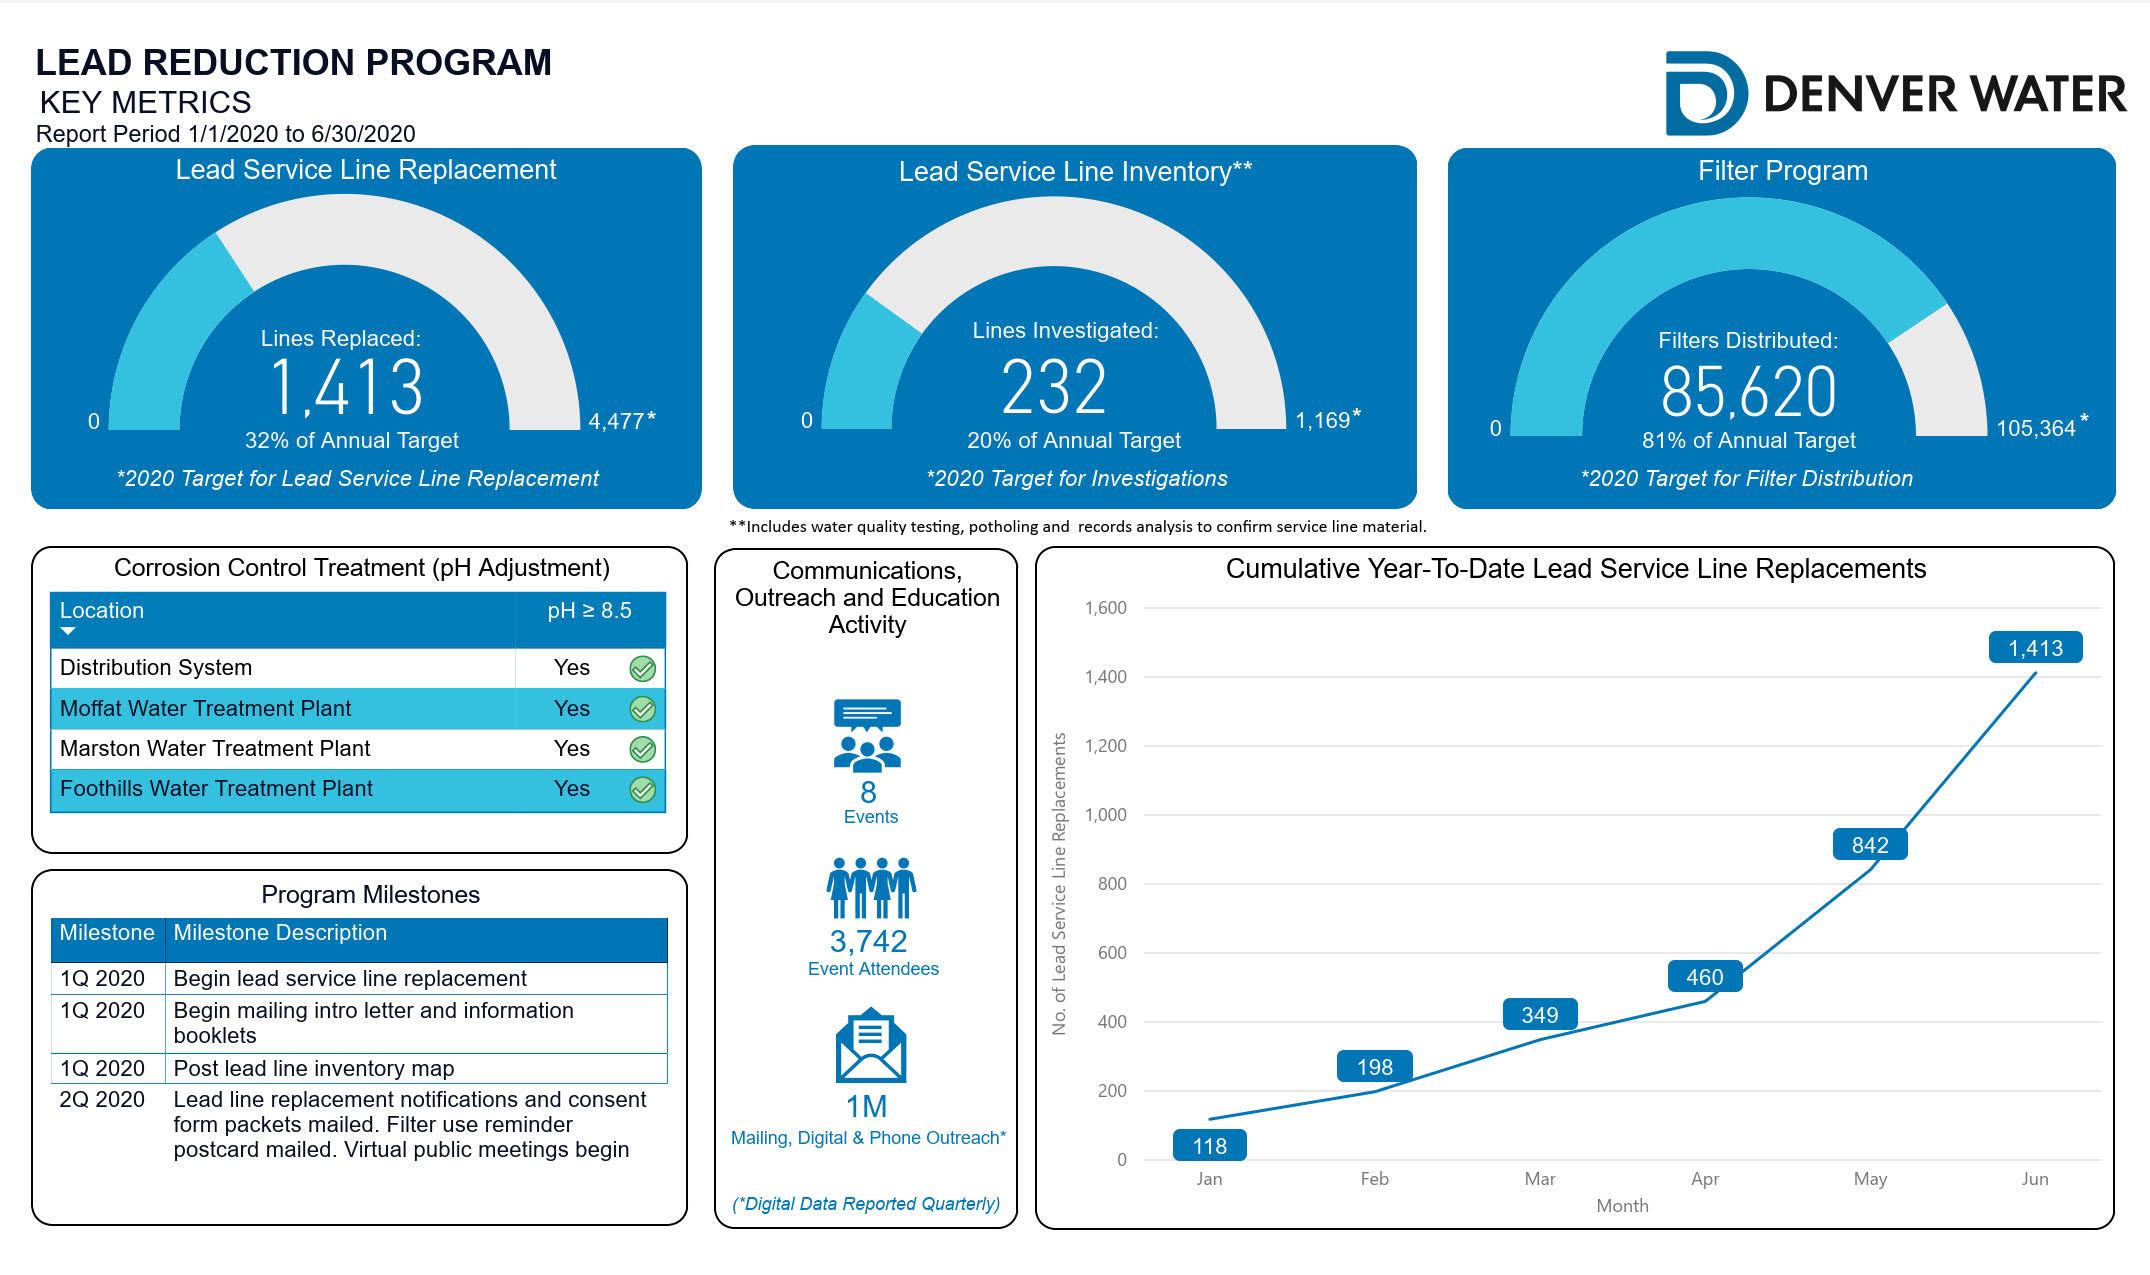
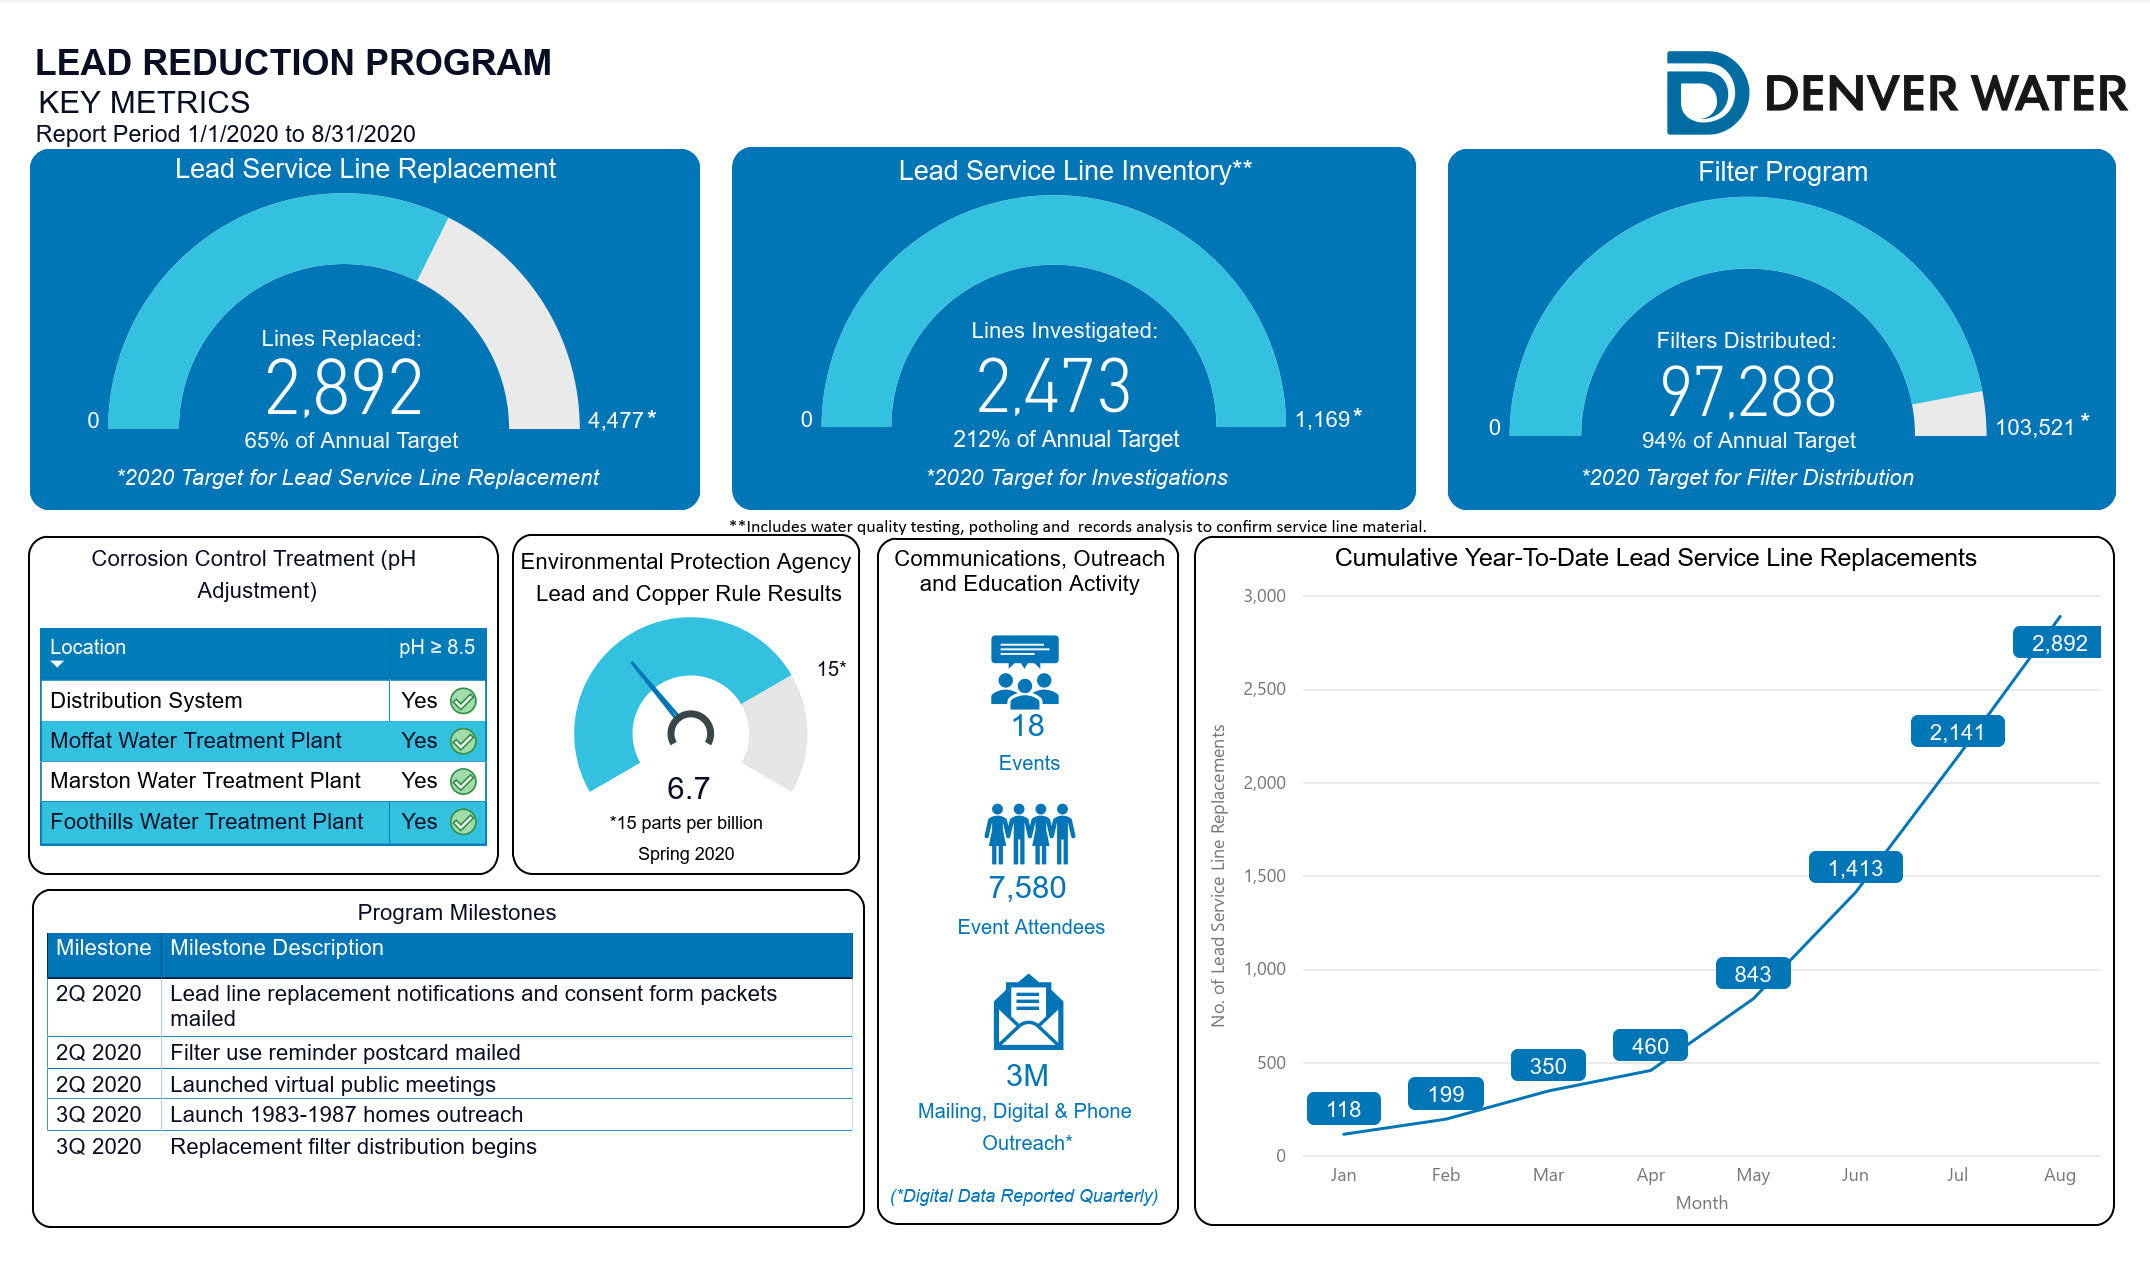
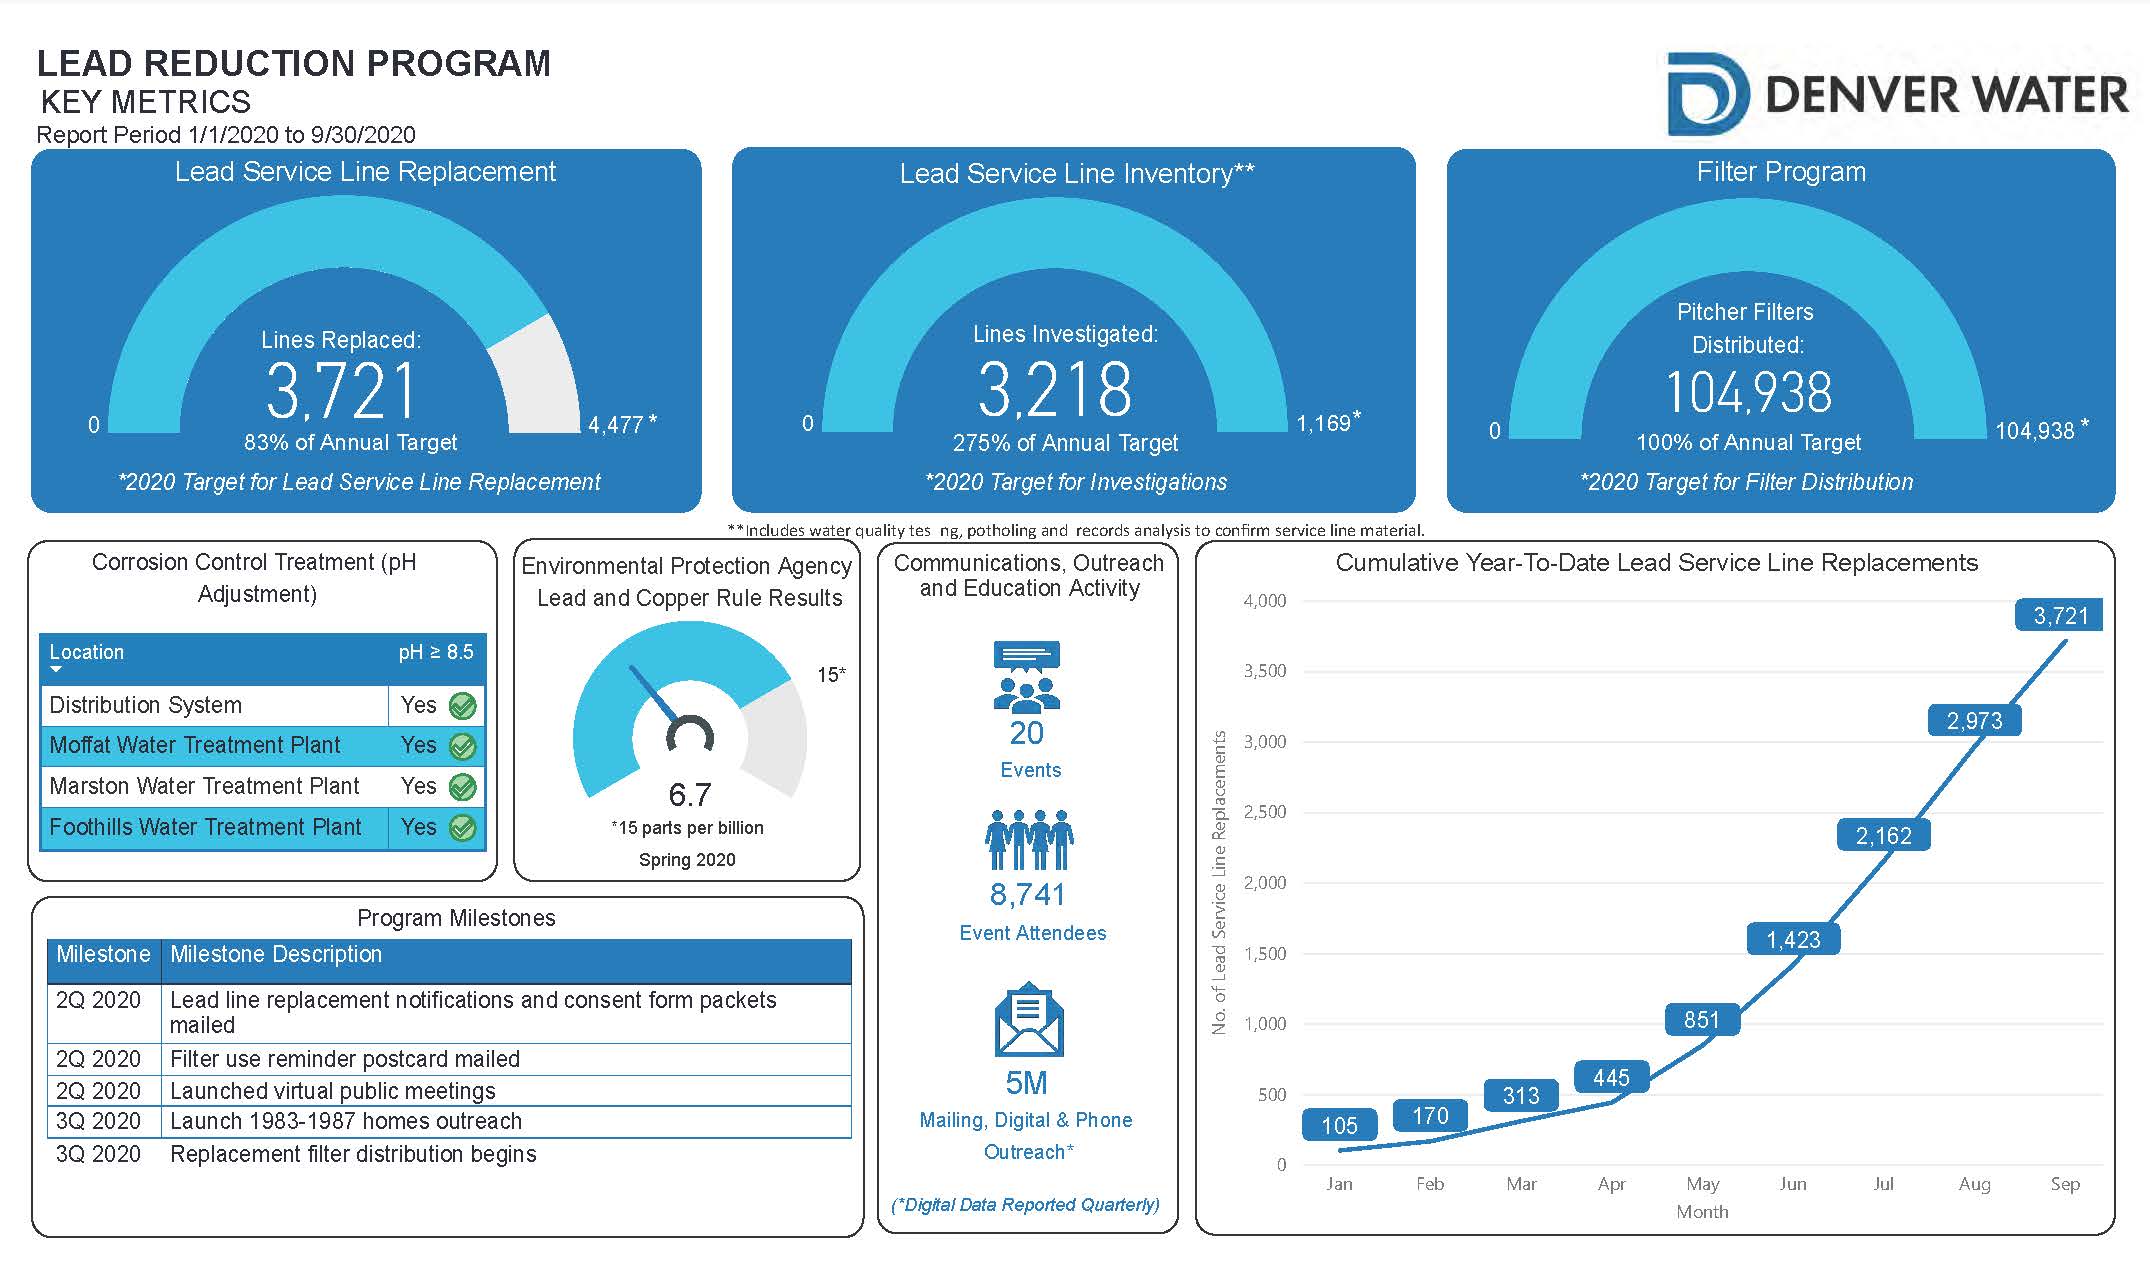
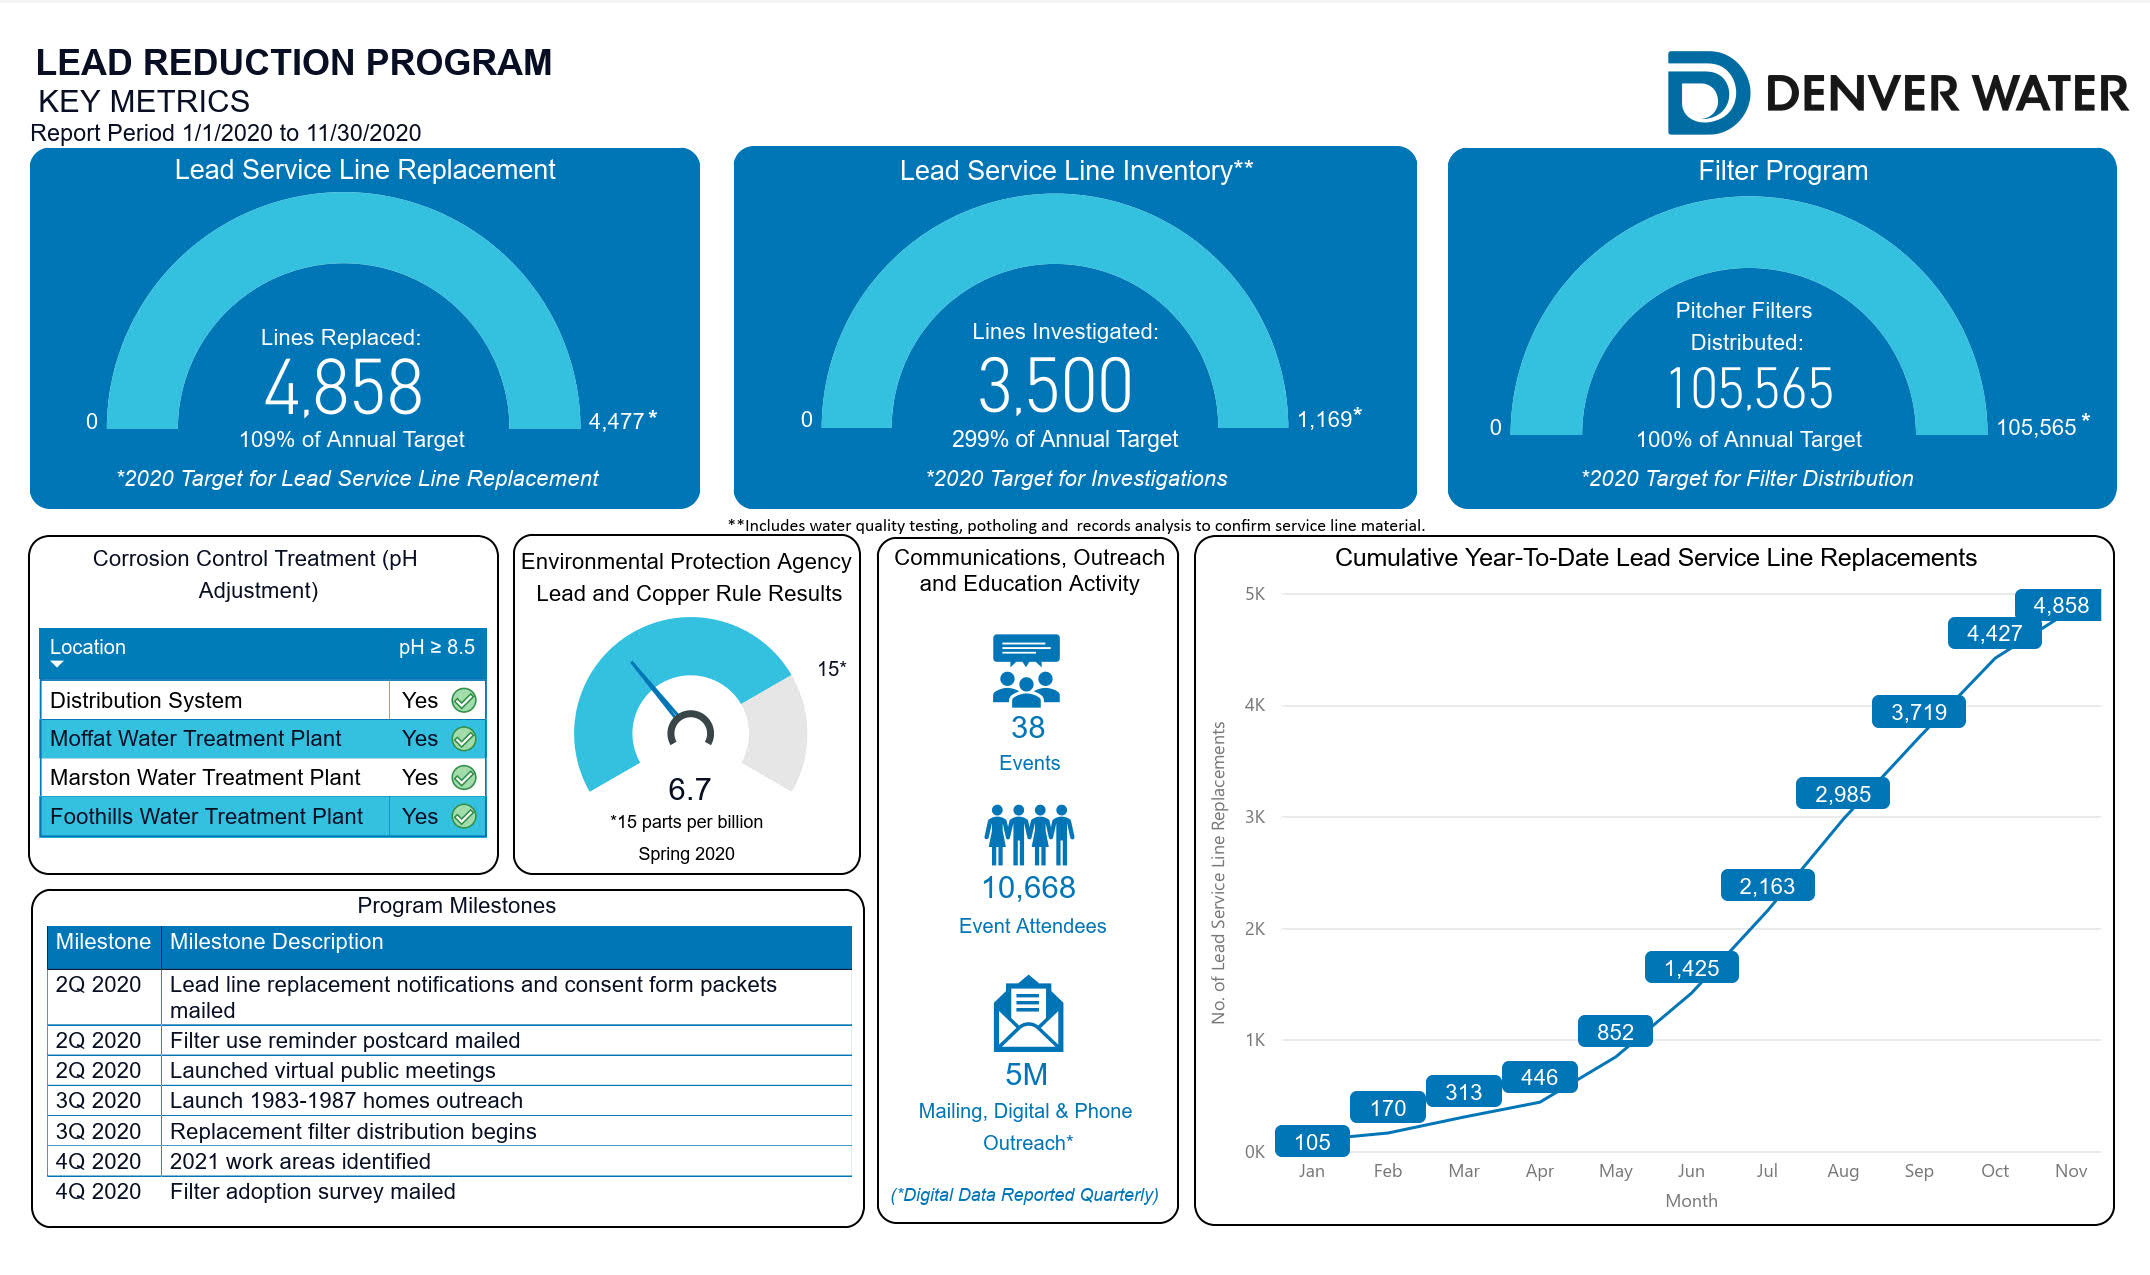
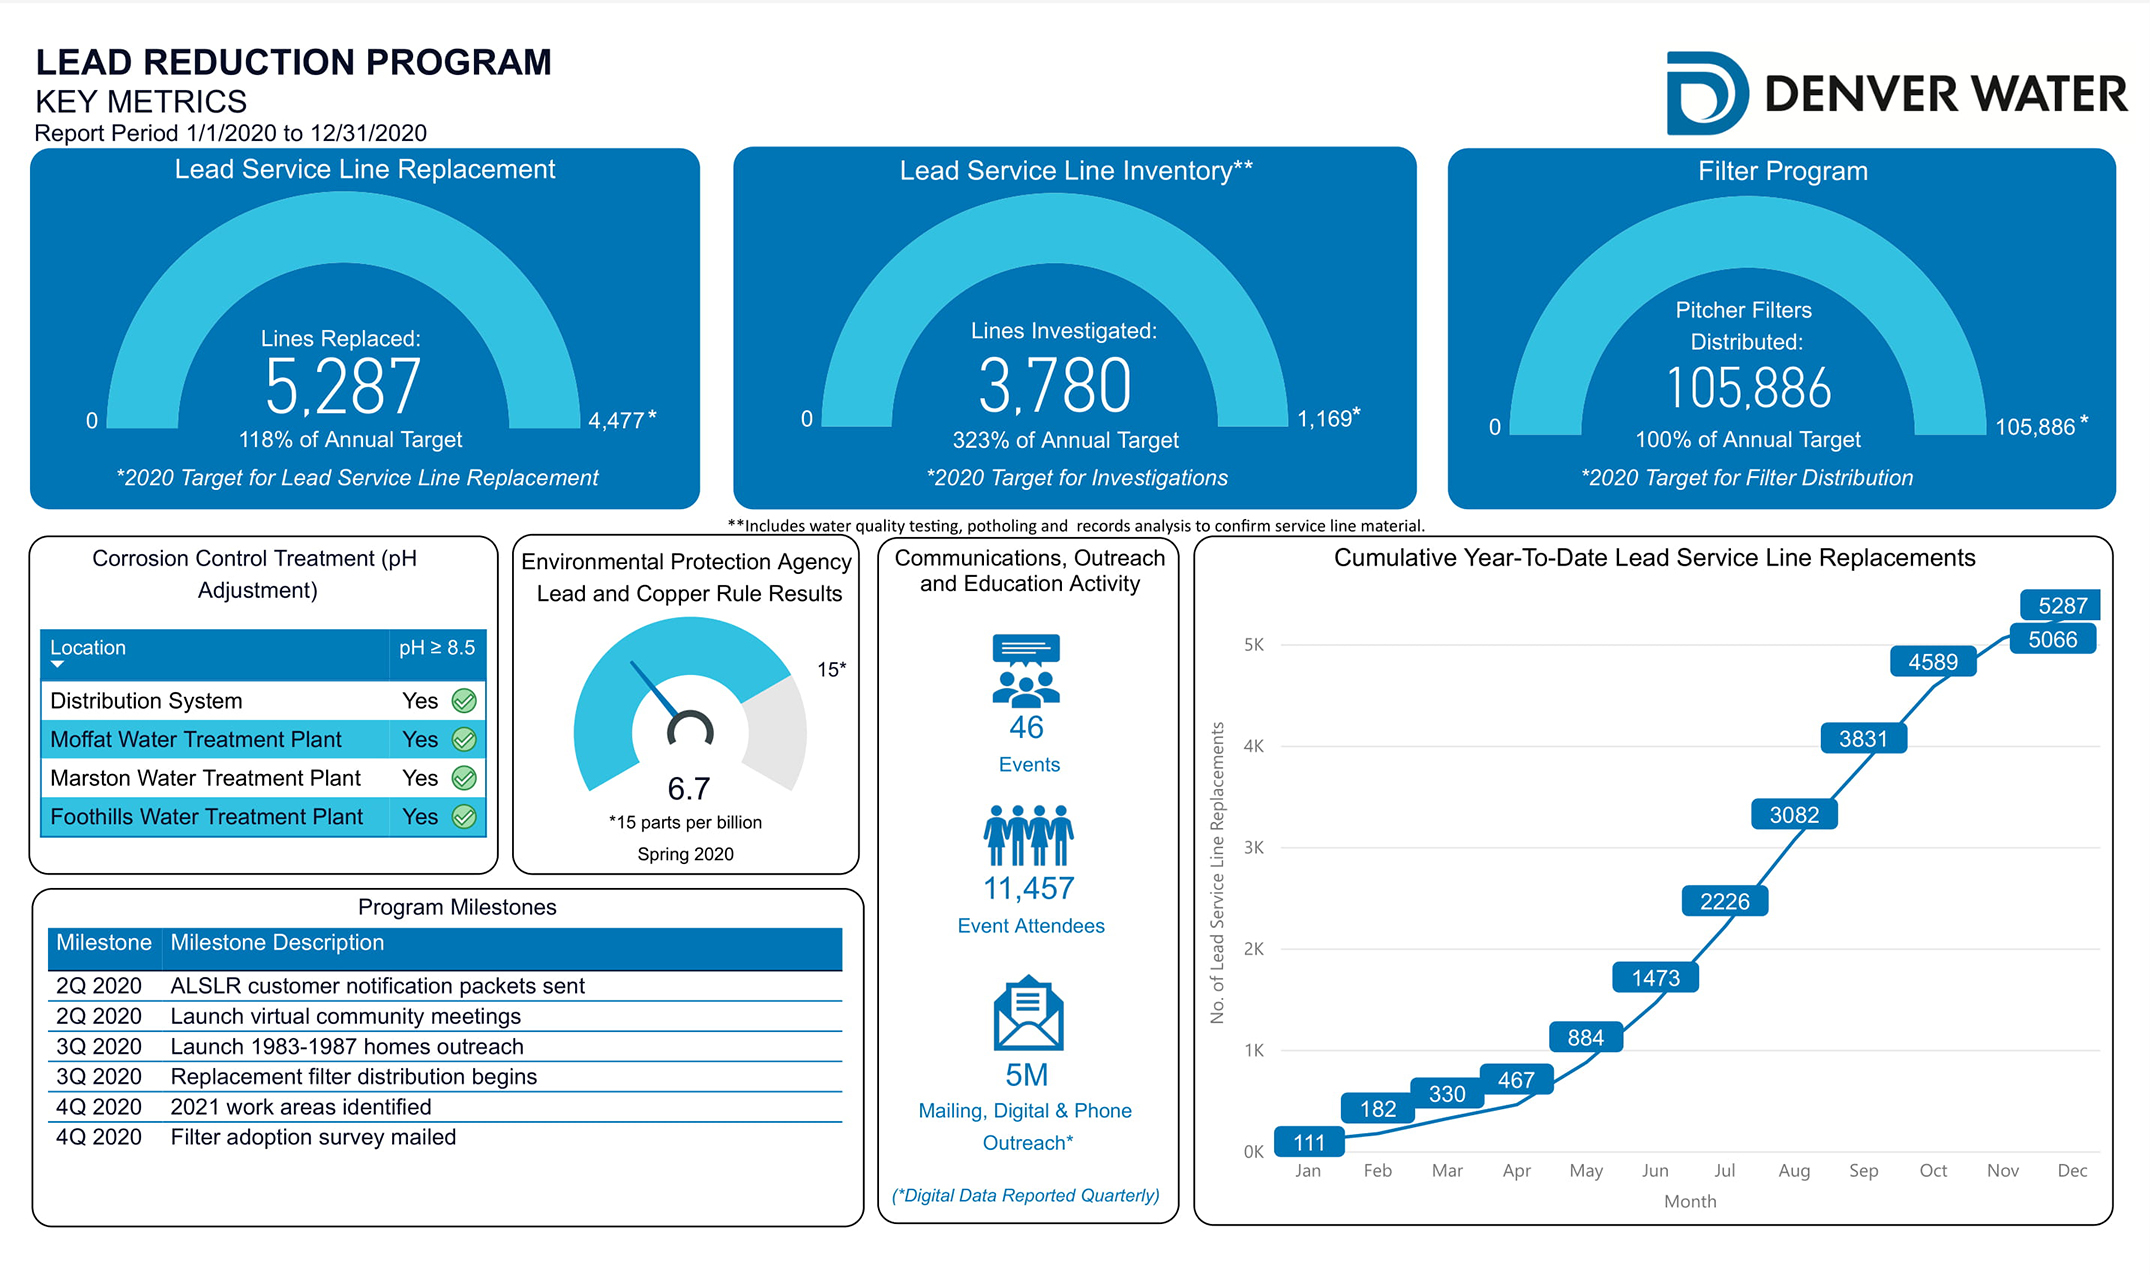
The dashboard reflects activity around the main components of the Lead Reduction Program and Denver Water’s commitment to equity:
- pH Adjustment: The science component of the project. Denver Water increased the pH of our water to reduce the risk of lead and other metals getting into drinking water from lead service lines or household plumbing.
- Inventory: The data component of the project that drives our construction schedule. Denver Water developed and maintains a publicly accessible inventory of all customer-owned lead service lines in Denver Water’s service area. The customer-owned service line is the pipe that brings water into the home from the main in the street to residents and businesses.
- Lead Service Line Replacement: The construction component of the project. Denver Water and our contractors are working year-round replacing all lead service lines with copper lines at no direct charge to the customer.
- Filter Program: The proactive component to protecting our customers enrolled in the program. Denver Water is providing a free water pitcher, filter and replacement filters, certified to remove lead, to all customers suspected of having a lead services line until six months after their line is replaced.
- Communications, Outreach and Education: The people component of the program. Together with our Community Partners, we are working to help increase our community’s awareness of the important work of the program.
- Equity: From the early discussions that became the Lead Reduction Program, equity, sometimes referred to as “health equity and environmental justice” in our reports (HE&EJ), has been a foundational principle driving planning, decision-making, resource allocation, strategy and tactical development, as well as work culture. Equity is not an additional consideration for these efforts; rather, it is the starting point. This commitment to advancing equity comes with a commitment to internal and external collaboration, learning by doing, openness, transparency and communication. You can see Denver Water’s commitment to equity in action in the Replacements in Impacted Communities quadrant.
Reports
2023
Lead Reduction Program — Annual Report — 2023
Lead Reduction Program — Semi-Annual Report — 2023
2022
Lead Reduction Program — Learn by Doing — 2022
Lead Reduction Program — Annual Report — 2022
Lead Reduction Program — Semi-Annual Report — S1 2022
2021
Lead Reduction Program — Learn by Doing — 2021
Lead Reduction Program — Annual Report — 2021